Council District 15
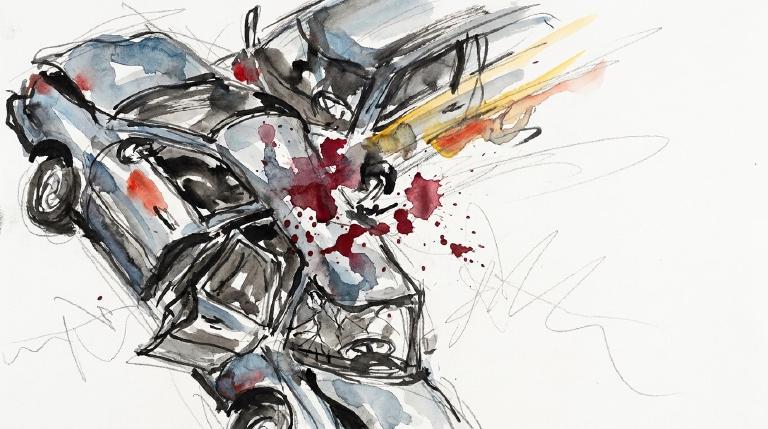
Crash Narratives
Council District 15 hit by a week of crashes and serious injuries
Council District 15 saw 28 crashes in seven days. Three people were seriously hurt and seven more had moderate injuries.
- 28 crashes in last 7 days
- 3 serious injuries
- A driver in an SUV went too fast on Valentine Avenue at E Burnside and hit a 32-year-old cyclist. The rider left with a leg injury and a fracture or dislocation.
- A distracted van driver hit a 58-year-old man outside 2515 Webster Ave. He suffered an abrasion to his shoulder and upper arm.
- Police recorded unsafe speed by an e-bike rider on E Tremont Avenue near Park Avenue. The 37-year-old rider was thrown from the bike and suffered a leg/foot injury with fracture and dislocation.
Bronx CD15 hit with 3 serious injuries in 7 days
Council District 15 saw 3 crashes and 3 serious injuries in one week. A speeding SUV hit a cyclist on Valentine Avenue. This district has triggered this alert 7 times in 90 days.
Council District 15 had 3 crashes from May 29 to June 5. Those crashes caused 3 serious injuries. This district has set off 7 alerts in 90 days. It has also set off 7 in 365 days.
On June 5 an SUV driver hit a 32 year old cyclist on Valentine Avenue. Police recorded unsafe speed. The cyclist had a leg injury with fracture or dislocation. On June 3 a distracted van driver hit a 58 year old pedestrian on Webster Avenue. The same day a 37 year old e bike rider was hurt on E Tremont Avenue.
Council Member Oswald Feliz can press DOT for hard street fixes now.
- 3 crashes in last 7 days
- 3 serious injuries
- A driver in an SUV went too fast on Valentine Avenue at E Burnside and hit a 32-year-old cyclist. The rider left with a leg injury and a fracture or dislocation.
- A distracted van driver hit a 58-year-old man outside 2515 Webster Ave. He suffered an abrasion to his shoulder and upper arm.
- Police recorded unsafe speed by an e-bike rider on E Tremont Avenue near Park Avenue. The 37-year-old rider was thrown from the bike and suffered a leg/foot injury with fracture and dislocation.
Council District 15: Traffic Crash Statistics
Crash Counter for District 15 748 crashes • 0 deaths
About these crash totals
Counts come from NYC police crash reports (NYPD Motor Vehicle Collisions on NYC Open Data). We sum all crashes, injuries, and deaths for this area across the selected time window shown on the card. Injury severity follows DOT's KABCO definitions mapped from the NYPD Person table (injury status, injury type, and injury location).
- Crashes: number of police‑reported collisions (all road users).
- All injuries: people with any reported injury (KABCO A/B/C or generic "injured").
- Moderate / Serious: suspected minor + suspected serious injuries (KABCO B + A).
- Deaths: killed or apparent death reported by police (KABCO K).
Change badges (arrows and percentages) compare the selected window with the same period last year whenever we have enough history. The “From 2022” view shows totals across the full span since 2022. When a comparison window isn’t available the badge shows an em dash.
Notes: Police reports can be corrected after initial publication. We cannot verify "death within 30 days" or hospital outcomes, so small differences from DOT totals are possible. Minor incidents without a police report are not included.
CloseCaught Speeding in CD 15 KXM7078 — 286 times
- 286 speed-camera tickets citywide in 12 monthsNY KXM7078 · 2022 Gray Ford PickupCaught here 14 times in the last 12 months.Typically speeds citywide in: East New York-New Lots (27), Crown Heights (North) (22), and Concourse-Concourse Village (16).
- 240 speed-camera tickets citywide in 12 monthsNY KWC3138 · 2022 Gray Mitsubishi SuburbanCaught here 72 times in the last 12 months.Typically speeds citywide in: Mount Hope (24), Fordham Heights (18), and Bedford Park (17).
- 206 speed-camera tickets citywide in 12 monthsNY LHW5598 · 2023 Black Toyota SedanCaught here 66 times in the last 12 months.Typically speeds citywide in: Mount Hope (23), Fordham Heights (17), and Claremont Village-Claremont (East) (14).
- 191 speed-camera tickets citywide in 12 monthsNY KZF9054 · 2023 Black Mitsubishi SuburbanCaught here 17 times in the last 12 months.Typically speeds citywide in: East New York-New Lots (13), Ocean Hill (11), and Crown Heights (North) (10).
- 178 speed-camera tickets citywide in 12 monthsNY KXM8750 · 2023 Black Mitsubishi SuburbanCaught here 2 times in the last 12 months.Typically speeds citywide in: St. Albans (23), South Jamaica (16), and Laurelton (15).
About this list
This ranks vehicles caught speeding in this area during the latest 12-month window by the number of NYC school-zone speed-camera violations they received anywhere in the city during that same window.
Camera violations are issued by NYC DOT’s program. Counts reflect issued tickets and may omit dismissed or pending cases. Plate text is shown verbatim as recorded.
CloseDangerous Schools in CD 15 Loading school hotspots...
| School | Crashes
Injuries
Child injuries
Deaths |
|---|
Dangerous Streets in CD 15 Loading street hotspots...
| Street | Crashes
Injuries
Child injuries
Deaths |
|---|
Dangerous Intersections in CD 15 Loading intersection hotspots...
| Intersection | Crashes
Injuries
Child injuries
Deaths |
|---|
Crash Finder
Try Crash Finder
Look up any street, school, address, or intersection to see how safe the streets are.
CD 15 Hot Spots Danger zones and recent crashes
Traffic Safety Timeline Tap to view recent events
Carnage in CD 15 13 Contusion/Bruise (Lower leg/foot)
▸ Severe Bleeding 2
▸ Severe Lacerations 1
▸ Concussion 4
▸ Fracture/Dislocation 10
▸ Internal Injury 2
▸ Whiplash 31
▸ Contusion/Bruise 37
▸ Abrasion 8
▸ Pain/Nausea 7
Crashes by Hour in CD 15 11 PM • 44 injuries ↑110%
Who is getting hurt? Kids 57 injuries ↑19% Seniors 29 injuries ↓22%
Toggle on at least one mode to see people totals.
Totals count people injured or killed. Use the mode filters above to focus the stacks.
Dangerous Bike Lanes in CD 15 Loading bike lane hotspots...
| Bike lane | Crashes
Cyclist injuries
Child injuries
Cyclist deaths |
|---|
What Crashes Cost Here Loading estimate...
Loading crash cost estimate...
The three blocks below show direct costs, other harm, and the total for crashes with injuries, crashes without injuries, and all crashes together.
How we calculate this
We calculate these costs using a method developed by the National Highway Traffic Safety Administration, or NHTSA. It gives one set of costs for crashes with injuries and another for crashes with no reported injuries.
Crashes with injuries cost much more because the method includes things like lost work, medical care, and long-term harm. NHTSA says crash costs include "lost productivity, medical, legal and court costs, emergency service, insurance administration, congestion, property damage, and workplace losses."
These are estimates, not bills. "Other harm" is the part of the broader estimate that goes beyond direct bills and insurance claims. It captures pain, disability, and lost quality of life.
Download the math (CSV) · Download the math (JSON) · Method and sources
Preventable Speeding 1,591 16+ offenders ↓77%
Repeat School-Zone Speeding Offenders
- ≥ 6: 4,601 (2026 year-to-date) • Prev: 19,937 2025 year-to-date
- ≥ 16: 1,591 (2026 year-to-date) • Prev: 7,062 2025 year-to-date
Pedestrian Injuries 97% by Cars and Trucks ↑10%
About this chart
We group pedestrian injuries and deaths by the vehicle type that struck them (as recorded in police reports). Use the year selector to compare the current window with the prior period.
- Trucks/Buses, SUVs/Cars, Mopeds, and Bikes reflect the broad categories we use to track vehicle harm.
- Counts include people on foot only; crashes with no injured pedestrians do not appear in this card.
Notes: Police classification can change during investigations. Small categories may have year-to-year variance.
CloseCouncil Member Oswald Feliz A (100)*
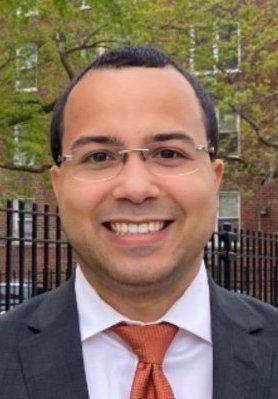
District 15
- 2024-12-19 · Vote · NYC Council – Legistar · ↓ hurts gradeFeliz votes yes on bill requiring FDNY consultation for street projects.
- 2024-12-05 · Sponsor · NYC Council – Legistar · ↑ helps gradeCouncil bill bars cars from blocking crosswalks. No standing or parking within 20 feet. City must install daylighting barriers at 1,000 intersections yearly. Streets clear. Sightlines open. Danger cut.
- 2024-09-26 · Vote · NYC Council – Legistar · ↑ helps gradeCouncil ends jaywalking penalties. Pedestrians now cross anywhere, any time. No summons. Law strips drivers of excuses. Streets shift. Power tilts to people on foot.
- • Neutral2024-08-15 · Vote · NYC Council – LegistarCity law now forces DOT to reveal where bikes and scooters go. Streets and bridges, protected or not. Data goes public. Riders’ movement, danger, and safety projects laid bare. No more hiding the facts.
- 2024-04-18 · Sponsor · NYC Council – Legistar · ↑ helps gradeCouncil orders swift removal of abandoned and unplated cars. Streets clear in 72 hours. Police target vehicles with missing or fake plates. Fewer hazards for those on foot and bike.
- 2024-04-11 · Sponsor · NYC Council – LegistarCouncil orders DOT to reveal bike and micromobility numbers. Streets and bridges get counted. Riders’ paths mapped. City must show where safety fails and where it works. Data goes public. No more hiding the truth.
- 2024-04-11 · Sponsor · NYC Council – Legistar · ↑ helps gradeCouncil targets hidden plates. Bill makes it a crime to park, stop, or drive with covered tags. Fines reach $1,000. Jail time possible. Committee weighs action. Streets demand accountability.
- 2024-03-19 · Sponsor · NYC Council – LegistarCouncil wants bold signs at every school entrance. Paint on pavement. Metal overhead. The aim: warn drivers, shield kids. The bill sits in committee. Streets wait. Danger does not.
- 2025-12-31 · Leadership · Streetsblog NYC · ↑ helps gradeMayor-elect Mamdani vows fast buses, bike lanes, carved streets. He talks space, not speed. Cars keep power, but cracks show in the armor.
- 2025-10-29 · Sponsor · NYC Council – Legistar · ↑ helps gradeInt 1439-2025 would require the NYPD to assign at least one crossing guard to every public and private K–8 school by Sept. 1, 2026. It places an adult between traffic and children at arrival and dismissal, changing street interactions around schools.
- 2025-09-25 · Sponsor · NYC Council – LegistarFeliz is primary sponsor of alternative transit fare study; safety uncertain.
- 2025-06-30 · Vote · NYC Council – Legistar · ↑ helps gradeCouncil orders swift removal of abandoned, derelict cars. Streets clear in 72 hours. No plates, no stickers, no excuses. Police and sanitation must act. Safer crossings for all who walk, ride, or wait.
- 2025-06-11 · Sponsor · NYC Council – Legistar · ↑ helps gradeCouncil bill forces property owners to face fines for neglected sidewalks. It caps penalties at $250 for failing DOT-directed repairs and for known defects that pose immediate danger upon notice. Introduced June 11, 2025; laid over in committee Nov. 24, 2025.
- 2025-06-11 · Sponsor · NYC Council – Legistar · ↑ helps gradeInt 1320-2025 would fine property owners up to $250 for failing to complete sidewalk repairs as directed by DOT or after notice of defects that pose an immediate danger to the public. Referred to Committee on Transportation and Infrastructure on June 11, 2025.
- 2025-06-11 · Sponsor · NYC Council – Legistar · ↑ helps gradeCouncil targets cracked sidewalks. Owners who ignore repairs face $250 fines. Defects left to fester mean danger for walkers, wheelchair users, and kids. The city moves to hold property owners to account.
- 2025-05-28 · Sponsor · NYC Council – Legistar · ↑ helps gradeCouncil pushes a bill to cut bike share costs for New Yorkers over 65. The measure aims to open city cycling to more seniors. The committee now weighs its next move.
- 2026-06-11 · Sponsor · NYC Council – LegistarFeliz co-sponsors weekly firearm discharge reporting bill; safety impact unclear.
- 2026-06-11 · Sponsor · NYC Council – LegistarFeliz co-sponsors weekly reporting on confirmed firearm discharges bill.
- 2026-04-16 · Sponsor · NYC Council – Legistar · ↑ helps gradeInt 0845-2026 puts DOT on the clock for dark blocks under elevated tracks. It orders a citywide lighting assessment, then installs where needed. Pedestrians and cyclists get brighter streets, if funding and approvals come.
- 2026-04-16 · Sponsor · NYC Council – Legistar · ↑ helps gradeInt 0845-2026 targets the dark blocks under the el. It orders DOT to check sidewalks and streets, then install lights where needed. The bill now sits in committee.
573 East Fordham Road (Entrance on Hoffman Street), Bronx, NY 10458
718-842-8100
250 Broadway, Suite 1759, New York, NY 10007
212-788-6966
Borough President Vanessa L. Gibson —
Police Precinct NYPD 48th Precinct —
Other Geographies See nearby areas
▸ Other Geographies
District 15 Council District 15 sits in Bronx, Precinct 48.
It contains Bronx CB 3, Bronx CB 6, Bronx CB 27, Claremont Village-Claremont (East), Crotona Park, Mount Hope, Fordham Heights, West Farms, Tremont, Belmont, Bronx Park.
▸ See also
