Council District 2
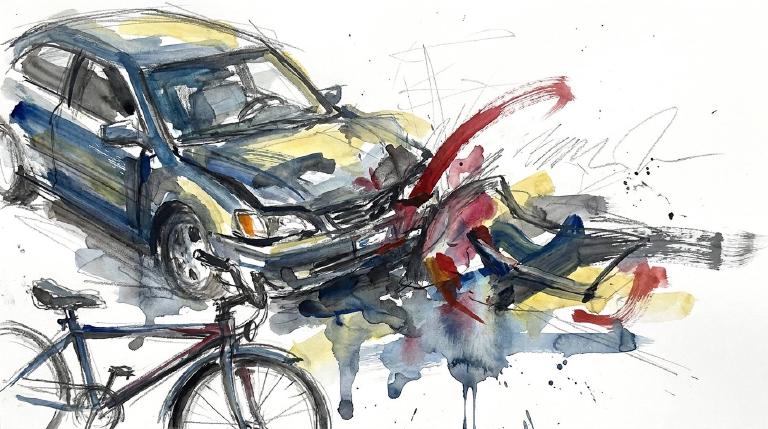
Crash Narratives
Council District 2: Traffic Crash Statistics
Crash Counter for District 2 438 crashes • 1 deaths
About these crash totals
Counts come from NYC police crash reports (NYPD Motor Vehicle Collisions on NYC Open Data). We sum all crashes, injuries, and deaths for this area across the selected time window shown on the card. Injury severity follows DOT's KABCO definitions mapped from the NYPD Person table (injury status, injury type, and injury location).
- Crashes: number of police‑reported collisions (all road users).
- All injuries: people with any reported injury (KABCO A/B/C or generic "injured").
- Moderate / Serious: suspected minor + suspected serious injuries (KABCO B + A).
- Deaths: killed or apparent death reported by police (KABCO K).
Change badges (arrows and percentages) compare the selected window with the same period last year whenever we have enough history. The “From 2022” view shows totals across the full span since 2022. When a comparison window isn’t available the badge shows an em dash.
Notes: Police reports can be corrected after initial publication. We cannot verify "death within 30 days" or hospital outcomes, so small differences from DOT totals are possible. Minor incidents without a police report are not included.
CloseCaught Speeding in CD 2 KXH2766 — 173 times
- 173 speed-camera tickets citywide in 12 monthsNY KXH2766 · 2022 Gray Kia SedanCaught here 1 time in the last 12 months.Typically speeds citywide in: Tompkinsville-Stapleton-Clifton-Fox Hills (38), Mariner's Harbor-Arlington-Graniteville (33), and West New Brighton-Silver Lake-Grymes Hill (18).
- 168 speed-camera tickets citywide in 12 monthsPA KZC2999 · 2019 Nissan SedanCaught here 2 times in the last 12 months.Typically speeds citywide in: Flatbush (West)-Ditmas Park-Parkville (13), Bensonhurst (11), and Mapleton-Midwood (West) (9).
- 165 speed-camera tickets citywide in 12 monthsNJ A35WNJ · 2024 Audi SedaCaught here 1 time in the last 12 months.Typically speeds citywide in: East Flatbush-Remsen Village (17), East Flatbush-Rugby (15), and Crown Heights (North) (14).
- 158 speed-camera tickets citywide in 12 monthsNY LFB3565 · 2023 Black Chrys SuburbanCaught here 2 times in the last 12 months.Typically speeds citywide in: Crown Heights (North) (15), Bedford-Stuyvesant (West) (14), and East New York (North) (11).
- 149 speed-camera tickets citywide in 12 monthsNY LHW5785 · 2024 Black Toyota SuburbanCaught here 1 time in the last 12 months.Typically speeds citywide in: Crown Heights (North) (14), Bedford-Stuyvesant (West) (12), and Ocean Hill (11).
About this list
This ranks vehicles caught speeding in this area during the latest 12-month window by the number of NYC school-zone speed-camera violations they received anywhere in the city during that same window.
Camera violations are issued by NYC DOT’s program. Counts reflect issued tickets and may omit dismissed or pending cases. Plate text is shown verbatim as recorded.
CloseDangerous Schools in CD 2 Loading school hotspots...
| School | Crashes
Injuries
Child injuries
Deaths |
|---|
Dangerous Streets in CD 2 Loading street hotspots...
| Street | Crashes
Injuries
Child injuries
Deaths |
|---|
Dangerous Intersections in CD 2 Loading intersection hotspots...
| Intersection | Crashes
Injuries
Child injuries
Deaths |
|---|
Crash Finder
Try Crash Finder
Look up any street, school, address, or intersection to see how safe the streets are.
CD 2 Hot Spots Danger zones and recent crashes
Traffic Safety Timeline Tap to view recent events
Carnage in CD 2 7 Abrasion (Lower leg/foot)
▸ Killed 1
▸ Crush Injuries 1
▸ Severe Lacerations 1
▸ Concussion 3
▸ Fracture/Dislocation 5
▸ Internal Injury 3
▸ Whiplash 4
▸ Contusion/Bruise 21
▸ Abrasion 19
▸ Pain/Nausea 9
Crashes by Hour in CD 2 2 PM • 18 injuries →0%
Who is getting hurt? Kids 8 injuries ↓33% Seniors 17 injuries ↓23%
Toggle on at least one mode to see people totals.
Totals count people injured or killed. Use the mode filters above to focus the stacks.
Dangerous Bike Lanes in CD 2 Loading bike lane hotspots...
| Bike lane | Crashes
Cyclist injuries
Child injuries
Cyclist deaths |
|---|
What Crashes Cost Here Loading estimate...
Loading crash cost estimate...
The three blocks below show direct costs, other harm, and the total for crashes with injuries, crashes without injuries, and all crashes together.
How we calculate this
We calculate these costs using a method developed by the National Highway Traffic Safety Administration, or NHTSA. It gives one set of costs for crashes with injuries and another for crashes with no reported injuries.
Crashes with injuries cost much more because the method includes things like lost work, medical care, and long-term harm. NHTSA says crash costs include "lost productivity, medical, legal and court costs, emergency service, insurance administration, congestion, property damage, and workplace losses."
These are estimates, not bills. "Other harm" is the part of the broader estimate that goes beyond direct bills and insurance claims. It captures pain, disability, and lost quality of life.
Download the math (CSV) · Download the math (JSON) · Method and sources
Preventable Speeding 724 16+ offenders ↓71%
Repeat School-Zone Speeding Offenders
- ≥ 6: 1,833 (2026 year-to-date) • Prev: 5,940 2025 year-to-date
- ≥ 16: 724 (2026 year-to-date) • Prev: 2,479 2025 year-to-date
Pedestrian Injuries 88% by Cars and Trucks ↓18%
About this chart
We group pedestrian injuries and deaths by the vehicle type that struck them (as recorded in police reports). Use the year selector to compare the current window with the prior period.
- Trucks/Buses, SUVs/Cars, Mopeds, and Bikes reflect the broad categories we use to track vehicle harm.
- Counts include people on foot only; crashes with no injured pedestrians do not appear in this card.
Notes: Police classification can change during investigations. Small categories may have year-to-year variance.
CloseCouncil Member Harvey D. Epstein A (100)*

District 2
- 2026-04-30 · Sponsor · NYC Council – LegistarInt 0866-2026 targets surprise street upheaval. It orders DOT to post warning signs near long disruptions. Closures, reroutes, and station moves would have a clock and a contact.
- 2026-04-30 · Sponsor · NYC Council – LegistarInt 0866-2026 would force DOT to post 48-hour warnings around disruptive work. Closures and reroutes hit sidewalks, bus stops, and bike-share docks. The bill now sits in committee.
- 2026-04-30 · Sponsor · NYC Council – LegistarInt 0866-2026 targets street and sidewalk shutdowns. DOT would post signs within 500 feet, 48 hours ahead. The work’s who, where, and when would be on the street.
- 2026-04-16 · Sponsor · NYC Council – LegistarEpstein co-sponsors bill updating streetlight lighting controls; no safety impact.
254 East 4th Street, New York, NY 10009
212-677-1077
250 Broadway, Suite 1820, New York, NY 10007
212-788-7366
Borough President Brad Hoylman-Sigal —
Police Precinct NYPD 9th Precinct —
Other Geographies See nearby areas
▸ Other Geographies
District 2 Council District 2 sits in Manhattan, Precinct 9.
It contains Manhattan CB 2, Manhattan CB 3, Greenwich Village, Lower East Side, East Village, Gramercy.
▸ See also
