Council District 38
Crash Narratives
Council District 38: Traffic Crash Statistics
Crash Counter for District 38 749 crashes • 0 deaths
About these crash totals
Counts come from NYC police crash reports (NYPD Motor Vehicle Collisions on NYC Open Data). We sum all crashes, injuries, and deaths for this area across the selected time window shown on the card. Injury severity follows DOT's KABCO definitions mapped from the NYPD Person table (injury status, injury type, and injury location).
- Crashes: number of police‑reported collisions (all road users).
- All injuries: people with any reported injury (KABCO A/B/C or generic "injured").
- Moderate / Serious: suspected minor + suspected serious injuries (KABCO B + A).
- Deaths: killed or apparent death reported by police (KABCO K).
Change badges (arrows and percentages) compare the selected window with the same period last year whenever we have enough history. The “From 2022” view shows totals across the full span since 2022. When a comparison window isn’t available the badge shows an em dash.
Notes: Police reports can be corrected after initial publication. We cannot verify "death within 30 days" or hospital outcomes, so small differences from DOT totals are possible. Minor incidents without a police report are not included.
CloseCaught Speeding in CD 38 KXH2766 — 173 times
- 173 speed-camera tickets citywide in 12 monthsNY KXH2766 · 2022 Gray Kia SedanCaught here 5 times in the last 12 months.Typically speeds citywide in: Tompkinsville-Stapleton-Clifton-Fox Hills (38), Mariner's Harbor-Arlington-Graniteville (33), and West New Brighton-Silver Lake-Grymes Hill (18).
- 168 speed-camera tickets citywide in 12 monthsPA KZC2999 · 2019 Nissan SedanCaught here 2 times in the last 12 months.Typically speeds citywide in: Flatbush (West)-Ditmas Park-Parkville (13), Bensonhurst (11), and Mapleton-Midwood (West) (9).
- 130 speed-camera tickets citywide in 12 monthsNY LFB3893 · 2023 Black Chrys SuburbanCaught here 1 time in the last 12 months.Typically speeds citywide in: Coney Island-Sea Gate (13), Gravesend (East)-Homecrest (9), and Mapleton-Midwood (West) (7).
- 123 speed-camera tickets citywide in 12 monthsNY KJK3063 · 2024 Black Cadillac SuburbanCaught here 2 times in the last 12 months.Typically speeds citywide in: Port Richmond (31), Mariner's Harbor-Arlington-Graniteville (12), and Arden Heights-Rossville (10).
- 121 speed-camera tickets citywide in 12 monthsNC KMZ9541 · 2024 White BMW 4SCaught here 1 time in the last 12 months.Typically speeds citywide in: Prospect Lefferts Gardens-Wingate (22), Canarsie (15), and Crown Heights (North) (11).
About this list
This ranks vehicles caught speeding in this area during the latest 12-month window by the number of NYC school-zone speed-camera violations they received anywhere in the city during that same window.
Camera violations are issued by NYC DOT’s program. Counts reflect issued tickets and may omit dismissed or pending cases. Plate text is shown verbatim as recorded.
CloseDangerous Schools in CD 38 Loading school hotspots...
| School | Crashes
Injuries
Child injuries
Deaths |
|---|
Dangerous Streets in CD 38 Loading street hotspots...
| Street | Crashes
Injuries
Child injuries
Deaths |
|---|
Dangerous Intersections in CD 38 Loading intersection hotspots...
| Intersection | Crashes
Injuries
Child injuries
Deaths |
|---|
Crash Finder
Try Crash Finder
Look up any street, school, address, or intersection to see how safe the streets are.
CD 38 Hot Spots Danger zones and recent crashes
Traffic Safety Timeline Tap to view recent events
Carnage in CD 38 12 Whiplash (Neck)
▸ Crush Injuries 1
▸ Severe Bleeding 1
▸ Severe Lacerations 1
▸ Concussion 7
▸ Fracture/Dislocation 4
▸ Internal Injury 2
▸ Whiplash 35
▸ Contusion/Bruise 36
▸ Abrasion 12
▸ Pain/Nausea 10
Crashes by Hour in CD 38 5 PM • 38 injuries ↑81%
Who is getting hurt? Kids 42 injuries ↑45% Seniors 32 injuries ↓8.6%
Toggle on at least one mode to see people totals.
Totals count people injured or killed. Use the mode filters above to focus the stacks.
Dangerous Bike Lanes in CD 38 Loading bike lane hotspots...
| Bike lane | Crashes
Cyclist injuries
Child injuries
Cyclist deaths |
|---|
What Crashes Cost Here Loading estimate...
Loading crash cost estimate...
The three blocks below show direct costs, other harm, and the total for crashes with injuries, crashes without injuries, and all crashes together.
How we calculate this
We calculate these costs using a method developed by the National Highway Traffic Safety Administration, or NHTSA. It gives one set of costs for crashes with injuries and another for crashes with no reported injuries.
Crashes with injuries cost much more because the method includes things like lost work, medical care, and long-term harm. NHTSA says crash costs include "lost productivity, medical, legal and court costs, emergency service, insurance administration, congestion, property damage, and workplace losses."
These are estimates, not bills. "Other harm" is the part of the broader estimate that goes beyond direct bills and insurance claims. It captures pain, disability, and lost quality of life.
Download the math (CSV) · Download the math (JSON) · Method and sources
Preventable Speeding 1,715 16+ offenders ↓74%
Repeat School-Zone Speeding Offenders
- ≥ 6: 4,329 (2026 year-to-date) • Prev: 15,889 2025 year-to-date
- ≥ 16: 1,715 (2026 year-to-date) • Prev: 6,655 2025 year-to-date
Pedestrian Injuries 100% by Cars and Trucks ↓15%
About this chart
We group pedestrian injuries and deaths by the vehicle type that struck them (as recorded in police reports). Use the year selector to compare the current window with the prior period.
- Trucks/Buses, SUVs/Cars, Mopeds, and Bikes reflect the broad categories we use to track vehicle harm.
- Counts include people on foot only; crashes with no injured pedestrians do not appear in this card.
Notes: Police classification can change during investigations. Small categories may have year-to-year variance.
CloseCouncil Member Alexa Avilés A (99)
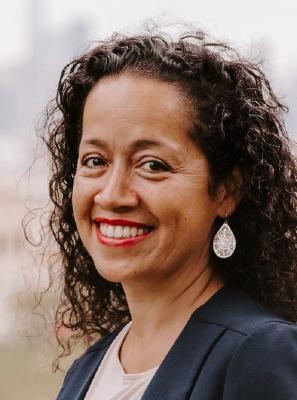
District 38
- 2024-12-19 · Vote · NYC Council – Legistar · ↓ hurts gradeAvilés votes yes on bill requiring FDNY consultation for street projects.
- 2024-12-05 · Sponsor · NYC Council – Legistar · ↑ helps gradeCouncil bill bars cars from blocking crosswalks. No standing or parking within 20 feet. City must install daylighting barriers at 1,000 intersections yearly. Streets clear. Sightlines open. Danger cut.
- • Neutral2024-09-26 · Sponsor · NYC Council – LegistarCouncil bill slashes legal parking time for big rigs. Ninety minutes max for tractor-trailers. Three hours for other commercial trucks. Streets clear faster. Heavy metal moves on.
- 2024-09-26 · Vote · NYC Council – Legistar · ↑ helps gradeCouncil ends jaywalking penalties. Pedestrians now cross anywhere, any time. No summons. Law strips drivers of excuses. Streets shift. Power tilts to people on foot.
- 2024-04-18 · Sponsor · NYC Council – Legistar · ↑ helps gradeCouncil orders swift removal of abandoned and unplated cars. Streets clear in 72 hours. Police target vehicles with missing or fake plates. Fewer hazards for those on foot and bike.
- 2024-03-19 · Sponsor · NYC Council – Legistar · ↑ helps gradeCouncil bill orders DOT to repair broken curbs during street resurfacing. Hazardous curbs trip, trap, and injure. The fix is overdue. Pedestrians need solid ground. Council moves to force action.
- 2024-03-07 · Sponsor · NYC Council – Legistar · ↑ helps gradeCouncil bill demands DOT fix NYCHA sidewalks first. Seniors come before all. Broken walks trip, injure, kill. Law forces city to show its work. No more hiding behind red tape.
- 2024-02-28 · Sponsor · NYC Council – Legistar · ↑ helps gradeCouncil moves to outlaw fake plates. Fraud hides reckless drivers. Bill targets sellers, sets fines. Streets need truth. Law aims to strip shields from danger.
- 2025-10-29 · Sponsor · NYC Council – Legistar · ↑ helps gradeStricter limits, supervisor authorization, and a ban on PIT maneuvers reduce the frequency and intensity of high‑speed chases, lowering risk to pedestrians and cyclists. Aerial handoff and disengagement further shift enforcement away from dangerous street pursuits, improving system-wide safety.
- 2025-10-29 · Sponsor · NYC Council – LegistarInt 1446-2025 forces DOT to accept sidewalk and roadway cafe applications online and at public locations. Applicants can save drafts. It bars mandatory professional drawing approval while preserving DOT review of required clearances.
- 2025-08-26 · Leadership · amny.com · ↑ helps gradeMayor Adams vetoed a council push to decriminalize street vending. Vendors clustered on the narrow Brooklyn Bridge walkway. Crowding squeezes pedestrians, collides with cyclists and strollers, and can impede emergency movement, raising crash and injury risk.
- 2025-07-24 · Leadership · BKReader · ↑ helps gradeEighty dead or maimed on Third Avenue since 2018. Sunset Park stands up. Residents, officials, and advocates demand the city end delays. No fixes yet. Danger remains.
- 2025-05-28 · Sponsor · NYC Council – Legistar · ↑ helps gradeCouncil pushes a bill to cut bike share costs for New Yorkers over 65. The measure aims to open city cycling to more seniors. The committee now weighs its next move.
- 2025-05-28 · Sponsor · NYC Council – Legistar · ↑ helps gradeCouncil bill pushes for discounted bike share rates for New Yorkers 65 and up. The move aims to open city streets to older riders. The measure sits with the Transportation Committee. No safety review yet.
- 2025-05-01 · Vote · NYC Council – LegistarCouncil passes law. Taxis and for-hire cars must post bold warnings on rear doors. Riders face the message: look for cyclists before swinging the door. A move to cut dooring. City acts. Cyclists stay in the crosshairs.
- 2025-04-10 · Vote · NYC Council – Legistar · ↑ helps gradeCouncil passed a law forcing DOT to post sharp, regular updates on street safety projects. Progress on bike lanes, bus lanes, and signals must go public. No more hiding delays or cost overruns. The city must show its work.
- 2026-05-08 · Leadership · Streetsblog NYC · ↓ hurts gradeAfter her truck-map bill widened routes, Alexa Avilés demanded fewer trucks. City Hall moves to expand the network anyway. Big rigs and blind spots press closer to sidewalks and bike lanes.
- 2026-05-07 · Leadership · Streetsblog NYC · ↑ helps gradeGreen-Wood pitched a two-way protected bike path and wider sidewalks. The corridor has seen 97 crashes, 128 injuries, and three deaths. It would trade curb parking for space where people walk and ride.
- • Neutral2026-02-24 · Sponsor · NYC Council – LegistarAvilés primarily sponsors bill setting NYPD firearm discharge blood alcohol testing procedures
- 2026-02-24 · Sponsor · NYC Council – LegistarAvilés primarily sponsors bill establishing officer blood alcohol testing after shootings.
4417 4th Avenue, Ground Floor, Brooklyn, NY 11220
718-439-9012
250 Broadway, Suite 1746, New York, NY 10007
212-788-7387
Borough President Antonio Reynoso —
Police Precinct NYPD 72nd Precinct —
Other Geographies See nearby areas
▸ Other Geographies
District 38 Council District 38 sits in Brooklyn, Precinct 72.
It contains Brooklyn CB 6, Brooklyn CB 7, Carroll Gardens-Cobble Hill-Gowanus-Red Hook, Sunset Park (West), Sunset Park (Central), Green-Wood Cemetery, Dyker Heights, Bensonhurst, Sunset Park (East)-Borough Park (West).
▸ See also
