Council District 39
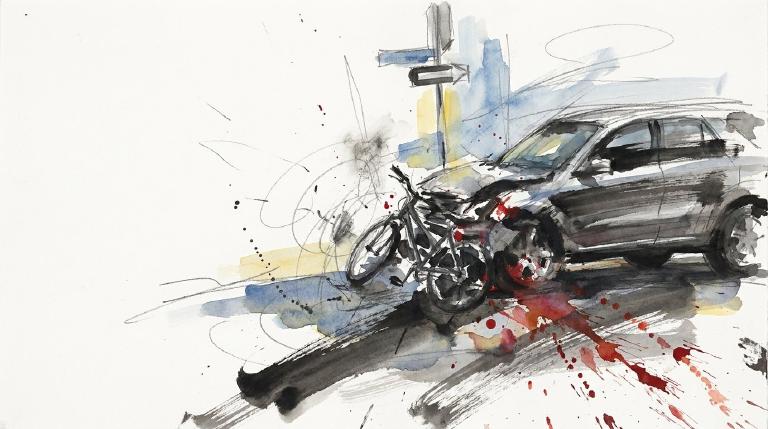
Crash Narratives
Council District 39: Traffic Crash Statistics
Crash Counter for District 39 652 crashes • 1 deaths
About these crash totals
Counts come from NYC police crash reports (NYPD Motor Vehicle Collisions on NYC Open Data). We sum all crashes, injuries, and deaths for this area across the selected time window shown on the card. Injury severity follows DOT's KABCO definitions mapped from the NYPD Person table (injury status, injury type, and injury location).
- Crashes: number of police‑reported collisions (all road users).
- All injuries: people with any reported injury (KABCO A/B/C or generic "injured").
- Moderate / Serious: suspected minor + suspected serious injuries (KABCO B + A).
- Deaths: killed or apparent death reported by police (KABCO K).
Change badges (arrows and percentages) compare the selected window with the same period last year whenever we have enough history. The “From 2022” view shows totals across the full span since 2022. When a comparison window isn’t available the badge shows an em dash.
Notes: Police reports can be corrected after initial publication. We cannot verify "death within 30 days" or hospital outcomes, so small differences from DOT totals are possible. Minor incidents without a police report are not included.
CloseCaught Speeding in CD 39 KXM7078 — 286 times
- 286 speed-camera tickets citywide in 12 monthsNY KXM7078 · 2022 Gray Ford PickupCaught here 4 times in the last 12 months.Typically speeds citywide in: East New York-New Lots (27), Crown Heights (North) (22), and Concourse-Concourse Village (16).
- 196 speed-camera tickets citywide in 12 monthsGA RUN1724 · 2020 Black BMW MpCaught here 13 times in the last 12 months.Typically speeds citywide in: Crown Heights (North) (88), Prospect Heights (19), and Spring Creek-Starrett City (12).
- 188 speed-camera tickets citywide in 12 monthsVA SZN9879 · 2016 Gray Mercedes-Benz SedanCaught here 1 time in the last 12 months.Typically speeds citywide in: East Flatbush-Rugby (59), Canarsie (14), and Flatlands (13).
- 176 speed-camera tickets citywide in 12 monthsGA SGY7043 · 2021 White Mercedes-Benz 4SCaught here 1 time in the last 12 months.Typically speeds citywide in: Canarsie (51), Sheepshead Bay-Manhattan Beach-Gerritsen Beach (19), and Baisley Park (14).
- 174 speed-camera tickets citywide in 12 monthsNY LHW6019 · 2024 Gray Toyota SedanCaught here 2 times in the last 12 months.Typically speeds citywide in: Crown Heights (North) (14), Ocean Hill (10), and East New York-New Lots (8).
About this list
This ranks vehicles caught speeding in this area during the latest 12-month window by the number of NYC school-zone speed-camera violations they received anywhere in the city during that same window.
Camera violations are issued by NYC DOT’s program. Counts reflect issued tickets and may omit dismissed or pending cases. Plate text is shown verbatim as recorded.
CloseDangerous Schools in CD 39 Loading school hotspots...
| School | Crashes
Injuries
Child injuries
Deaths |
|---|
Dangerous Streets in CD 39 Loading street hotspots...
| Street | Crashes
Injuries
Child injuries
Deaths |
|---|
Dangerous Intersections in CD 39 Loading intersection hotspots...
| Intersection | Crashes
Injuries
Child injuries
Deaths |
|---|
Crash Finder
Try Crash Finder
Look up any street, school, address, or intersection to see how safe the streets are.
CD 39 Hot Spots Danger zones and recent crashes
Traffic Safety Timeline Tap to view recent events
Carnage in CD 39 7 Minor Bleeding (Head)
▸ Killed 1
▸ Crush Injuries 3
▸ Severe Bleeding 1
▸ Severe Lacerations 2
▸ Concussion 3
▸ Fracture/Dislocation 4
▸ Internal Injury 3
▸ Whiplash 22
▸ Contusion/Bruise 24
▸ Abrasion 12
▸ Pain/Nausea 8
Crashes by Hour in CD 39 2 PM • 39 injuries ↑129%
Who is getting hurt? Kids 22 injuries ↓21% Seniors 24 injuries ↓25%
Toggle on at least one mode to see people totals.
Totals count people injured or killed. Use the mode filters above to focus the stacks.
Dangerous Bike Lanes in CD 39 Loading bike lane hotspots...
| Bike lane | Crashes
Cyclist injuries
Child injuries
Cyclist deaths |
|---|
What Crashes Cost Here Loading estimate...
Loading crash cost estimate...
The three blocks below show direct costs, other harm, and the total for crashes with injuries, crashes without injuries, and all crashes together.
How we calculate this
We calculate these costs using a method developed by the National Highway Traffic Safety Administration, or NHTSA. It gives one set of costs for crashes with injuries and another for crashes with no reported injuries.
Crashes with injuries cost much more because the method includes things like lost work, medical care, and long-term harm. NHTSA says crash costs include "lost productivity, medical, legal and court costs, emergency service, insurance administration, congestion, property damage, and workplace losses."
These are estimates, not bills. "Other harm" is the part of the broader estimate that goes beyond direct bills and insurance claims. It captures pain, disability, and lost quality of life.
Download the math (CSV) · Download the math (JSON) · Method and sources
Preventable Speeding 1,978 16+ offenders ↓67%
Repeat School-Zone Speeding Offenders
- ≥ 6: 4,534 (2026 year-to-date) • Prev: 13,699 2025 year-to-date
- ≥ 16: 1,978 (2026 year-to-date) • Prev: 6,041 2025 year-to-date
Pedestrian Injuries 96% by Cars and Trucks ↓19%
About this chart
We group pedestrian injuries and deaths by the vehicle type that struck them (as recorded in police reports). Use the year selector to compare the current window with the prior period.
- Trucks/Buses, SUVs/Cars, Mopeds, and Bikes reflect the broad categories we use to track vehicle harm.
- Counts include people on foot only; crashes with no injured pedestrians do not appear in this card.
Notes: Police classification can change during investigations. Small categories may have year-to-year variance.
CloseCouncil Member Shahana K. Hanif A (100)

District 39
- 2024-12-19 · Sponsor · NYC Council – Legistar · ↑ helps gradeCouncil moves to test bold pavement markings at crash sites. Five spots per borough. Focus: places where drivers have killed or maimed. Report to follow. Streets marked for danger.
- 2024-12-19 · Vote · NYC Council – Legistar · ↑ helps gradeHanif votes no on bill requiring FDNY input on street projects.
- 2024-12-05 · Sponsor · NYC Council – Legistar · ↑ helps gradeCouncil bill bars cars from blocking crosswalks. No standing or parking within 20 feet. City must install daylighting barriers at 1,000 intersections yearly. Streets clear. Sightlines open. Danger cut.
- 2024-11-13 · Sponsor · NYC Council – Legistar · ↑ helps gradeCouncil demands DOT show its work. The law forces public updates on every street safety project. No more hiding delays. No more silent cost overruns. Progress for bus riders, cyclists, and walkers must be tracked and posted.
- 2024-04-11 · Sponsor · NYC Council – LegistarCouncil orders DOT to reveal bike and micromobility numbers. Streets and bridges get counted. Riders’ paths mapped. City must show where safety fails and where it works. Data goes public. No more hiding the truth.
- 2024-03-19 · Sponsor · NYC Council – LegistarCouncil wants bold signs at every school entrance. Paint on pavement. Metal overhead. The aim: warn drivers, shield kids. The bill sits in committee. Streets wait. Danger does not.
- 2024-03-07 · Sponsor · NYC Council – Legistar · ↑ helps gradeCouncil bill demands DOT fix NYCHA sidewalks first. Seniors come before all. Broken walks trip, injure, kill. Law forces city to show its work. No more hiding behind red tape.
- 2024-03-07 · Sponsor · NYC Council – Legistar · ↑ helps gradeHanif co-sponsors resolution for unlimited subway and bus transfers.
- 2025-11-12 · Sponsor · NYC Council – Legistar · ↑ helps gradeGreater CCRB access to body‑camera footage can improve accountability and reduce biased or harmful traffic enforcement against pedestrians and cyclists, supporting equity and willingness to walk/bike. Effects on crash prevention and driver behavior are indirect and likely modest.
- 2025-10-09 · Sponsor · NYC Council – Legistar · ↑ helps gradeInt. 1421-2025 would widen outdoor dining: let grocery stores apply for sidewalk licenses, allow roadway cafes year-round, expand frontage for some cafes, and speed approvals. Committee laid it over on Nov. 24, 2025.
- 2025-10-09 · Sponsor · NYC Council – LegistarInt 1421-2025 would let restaurants and grocery stores run sidewalk and roadway cafes in curb or parking lanes year‑round. It speeds reviews, sets $1,050 fees and four‑year terms, and pushes dining closer to moving traffic — raising risks for pedestrians and cyclists.
- 2025-10-09 · Sponsor · NYC Council – LegistarYear‑round expansion of roadway/sidewalk cafes can calm traffic and create buffers that benefit pedestrians, but also risks obstructing sidewalks, complicating winter operations, and creating conflicts near bike lanes. Net safety effects for vulnerable users hinge on strict clear-path, loading, and bike-lane protection rules and enforcement.
- 2025-06-11 · Sponsor · NYC Council – LegistarCouncil bill orders bike and scooter share firms to show road rules at docks and in apps. Riders must review rules yearly. No extra fees. Aim: clear, visible reminders. Committee review underway.
- 2025-06-11 · Sponsor · NYC Council – LegistarCouncil bill orders bike and scooter share firms to show road rules on apps and stations. Riders must review rules yearly. No extra fees. Aim: clear, visible rules for all. Committee review underway.
- 2025-06-11 · Sponsor · NYC Council – LegistarCouncil bill demands bike and scooter share firms post road rules at stations and in apps. Riders must review rules yearly. No charge for time spent reading. City aims for clarity, not confusion.
- 2025-06-11 · Sponsor · NYC Council – Legistar · ↑ helps gradeHanif co-sponsors bill to create St. George–Bay Ridge ferry service.
- 2026-06-11 · Leadership · Brooklyn Paper · ↑ helps gradeJune 15 brings the Carroll Street Bridge back open. Cars and trucks are shut out. The span becomes a canal link for pedestrians, cyclists, and emergency vehicles.
- 2026-06-11 · Sponsor · NYC Council – LegistarHanif co-sponsors discounted CUNY bike share rate bill, no safety impact
- 2026-04-30 · Sponsor · NYC Council – LegistarHanif co-sponsors bill banning NYPD weaponized robots, safety impact unclear.
- 2026-03-17 · Leadership · Streetsblog NYC · ↑ helps gradeDOT is set to reopen the Carroll Street Bridge. Neighbors want a people-only span. They warn that bringing cars back restores conflict to a narrow crossing.
456 5th Avenue, 3rd Floor, Brooklyn, NY 11215
718-499-1090
250 Broadway, Suite 1745, New York, NY 10007
212-788-6969
Borough President Antonio Reynoso —
Police Precinct NYPD 78th Precinct —
Other Geographies See nearby areas
▸ Other Geographies
District 39 Council District 39 sits in Brooklyn, Precinct 78.
It contains Brooklyn CB 6, Brooklyn CB 55, Carroll Gardens-Cobble Hill-Gowanus-Red Hook, Park Slope, Windsor Terrace-South Slope, Kensington, Prospect Park.
▸ See also
