Council District 46
Crash Narratives
Council District 46 keeps getting hit
Council District 46 saw 22 crashes in 7 days. One person had serious injuries. Eight had moderate injuries. This district has triggered 10 times in 90 days.
From June 1 to June 8, Council District 46 had 22 crashes. One person suffered serious injuries. Eight suffered moderate injuries. This district has triggered 10 times in 90 days.
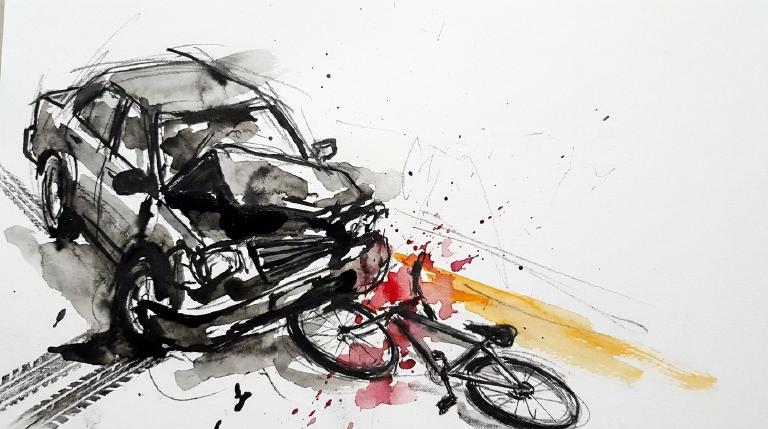
One case was on June 2 at Rockaway Parkway and Avenue K. Police recorded driver inattention as a driver hit a 40 year old cyclist. The rider had a head injury and minor bleeding. Council Member Mercedes Narcisse can press DOT for hard street fixes now.
- 22 crashes in last 7 days
- 1 serious injury
- Police recorded driver inattention as a driver hit a 40-year-old cyclist at Rockaway Parkway and Avenue K. The rider suffered a head injury and minor bleeding.
- A driver making a left turn on E 82nd Street hit a 22-year-old woman crossing with the signal. Police recorded failure to yield right-of-way.
- On Flatlands Avenue at E 53rd Street, a sedan driver making a right turn hit an SUV. Five people were injured, including passengers reporting pain and nausea and two others with bruises.
Council District 46: Traffic Crash Statistics
Crash Counter for District 46 712 crashes • 1 deaths
About these crash totals
Counts come from NYC police crash reports (NYPD Motor Vehicle Collisions on NYC Open Data). We sum all crashes, injuries, and deaths for this area across the selected time window shown on the card. Injury severity follows DOT's KABCO definitions mapped from the NYPD Person table (injury status, injury type, and injury location).
- Crashes: number of police‑reported collisions (all road users).
- All injuries: people with any reported injury (KABCO A/B/C or generic "injured").
- Moderate / Serious: suspected minor + suspected serious injuries (KABCO B + A).
- Deaths: killed or apparent death reported by police (KABCO K).
Change badges (arrows and percentages) compare the selected window with the same period last year whenever we have enough history. The “From 2022” view shows totals across the full span since 2022. When a comparison window isn’t available the badge shows an em dash.
Notes: Police reports can be corrected after initial publication. We cannot verify "death within 30 days" or hospital outcomes, so small differences from DOT totals are possible. Minor incidents without a police report are not included.
CloseCaught Speeding in CD 46 KXM7078 — 286 times
- 286 speed-camera tickets citywide in 12 monthsNY KXM7078 · 2022 Gray Ford PickupCaught here 1 time in the last 12 months.Typically speeds citywide in: East New York-New Lots (27), Crown Heights (North) (22), and Concourse-Concourse Village (16).
- 188 speed-camera tickets citywide in 12 monthsVA SZN9879 · 2016 Gray Mercedes-Benz SedanCaught here 24 times in the last 12 months.Typically speeds citywide in: East Flatbush-Rugby (59), Canarsie (14), and Flatlands (13).
- 176 speed-camera tickets citywide in 12 monthsGA SGY7043 · 2021 White Mercedes-Benz 4SCaught here 31 times in the last 12 months.Typically speeds citywide in: Canarsie (51), Sheepshead Bay-Manhattan Beach-Gerritsen Beach (19), and Baisley Park (14).
- 174 speed-camera tickets citywide in 12 monthsNY LHW6019 · 2024 Gray Toyota SedanCaught here 2 times in the last 12 months.Typically speeds citywide in: Crown Heights (North) (14), Ocean Hill (10), and East New York-New Lots (8).
- 173 speed-camera tickets citywide in 12 monthsNY KXH2766 · 2022 Gray Kia SedanCaught here 2 times in the last 12 months.Typically speeds citywide in: Tompkinsville-Stapleton-Clifton-Fox Hills (38), Mariner's Harbor-Arlington-Graniteville (33), and West New Brighton-Silver Lake-Grymes Hill (18).
About this list
This ranks vehicles caught speeding in this area during the latest 12-month window by the number of NYC school-zone speed-camera violations they received anywhere in the city during that same window.
Camera violations are issued by NYC DOT’s program. Counts reflect issued tickets and may omit dismissed or pending cases. Plate text is shown verbatim as recorded.
CloseDangerous Schools in CD 46 Loading school hotspots...
| School | Crashes
Injuries
Child injuries
Deaths |
|---|
Dangerous Streets in CD 46 Loading street hotspots...
| Street | Crashes
Injuries
Child injuries
Deaths |
|---|
Dangerous Intersections in CD 46 Loading intersection hotspots...
| Intersection | Crashes
Injuries
Child injuries
Deaths |
|---|
Crash Finder
Try Crash Finder
Look up any street, school, address, or intersection to see how safe the streets are.
CD 46 Hot Spots Danger zones and recent crashes
Traffic Safety Timeline Tap to view recent events
Carnage in CD 46 10 Whiplash (Neck)
▸ Killed 1
▸ Crush Injuries 1
▸ Severe Lacerations 2
▸ Concussion 1
▸ Fracture/Dislocation 4
▸ Internal Injury 6
▸ Whiplash 32
▸ Contusion/Bruise 14
▸ Abrasion 6
▸ Pain/Nausea 19
Crashes by Hour in CD 46 9 PM • 44 injuries ↑91%
Who is getting hurt? Kids 52 injuries ↑2.0% Seniors 62 injuries ↑15%
Toggle on at least one mode to see people totals.
Totals count people injured or killed. Use the mode filters above to focus the stacks.
Dangerous Bike Lanes in CD 46 Loading bike lane hotspots...
| Bike lane | Crashes
Cyclist injuries
Child injuries
Cyclist deaths |
|---|
What Crashes Cost Here Loading estimate...
Loading crash cost estimate...
The three blocks below show direct costs, other harm, and the total for crashes with injuries, crashes without injuries, and all crashes together.
How we calculate this
We calculate these costs using a method developed by the National Highway Traffic Safety Administration, or NHTSA. It gives one set of costs for crashes with injuries and another for crashes with no reported injuries.
Crashes with injuries cost much more because the method includes things like lost work, medical care, and long-term harm. NHTSA says crash costs include "lost productivity, medical, legal and court costs, emergency service, insurance administration, congestion, property damage, and workplace losses."
These are estimates, not bills. "Other harm" is the part of the broader estimate that goes beyond direct bills and insurance claims. It captures pain, disability, and lost quality of life.
Download the math (CSV) · Download the math (JSON) · Method and sources
Preventable Speeding 4,387 16+ offenders ↓72%
Repeat School-Zone Speeding Offenders
- ≥ 6: 9,078 (2026 year-to-date) • Prev: 31,510 2025 year-to-date
- ≥ 16: 4,387 (2026 year-to-date) • Prev: 15,765 2025 year-to-date
Pedestrian Injuries 99% by Cars and Trucks ↑35%
About this chart
We group pedestrian injuries and deaths by the vehicle type that struck them (as recorded in police reports). Use the year selector to compare the current window with the prior period.
- Trucks/Buses, SUVs/Cars, Mopeds, and Bikes reflect the broad categories we use to track vehicle harm.
- Counts include people on foot only; crashes with no injured pedestrians do not appear in this card.
Notes: Police classification can change during investigations. Small categories may have year-to-year variance.
CloseCouncil Member Mercedes Narcisse A (100)*
District 46
- 2024-12-19 · Vote · NYC Council – Legistar · ↓ hurts gradeNarcisse votes yes on bill requiring FDNY consultation for street projects.
- 2024-12-19 · Vote · NYC Council – Legistar · ↓ hurts gradeNarcisse votes yes on bill requiring FDNY consultation for street projects.
- 2024-11-13 · Sponsor · NYC Council – Legistar · ↑ helps gradeCouncil demands DOT show its work. The law forces public updates on every street safety project. No more hiding delays. No more silent cost overruns. Progress for bus riders, cyclists, and walkers must be tracked and posted.
- 2024-09-26 · Leadership · Streetsblog NYC · ↑ helps gradeCouncil scrapped jaywalking tickets. Pedestrians can cross outside crosswalks. Police lose a tool for targeting Black and Hispanic New Yorkers. The bill keeps some restrictions. Advocates call it a start, not a finish. The vote: 40 for, eight against.
- 2024-06-06 · Vote · NYC Council – Legistar · ↑ helps gradeCouncil calls for five mile per hour speed limit on Open Streets. Streets slow. Danger drops. Pedestrians and cyclists get space. Resolution adopted. Albany must act.
- 2024-05-22 · Leadership · Streetsblog NYC · ↑ helps gradeCouncil Member Narcisse moves to end NYPD’s biased jaywalking crackdowns. Black and Latino New Yorkers bear the brunt. The bill would legalize crossing mid-block and against the light. Only eight council members back it. NYPD stays silent.
- 2024-04-18 · Sponsor · NYC Council – Legistar · ↑ helps gradeCouncil orders swift removal of abandoned and unplated cars. Streets clear in 72 hours. Police target vehicles with missing or fake plates. Fewer hazards for those on foot and bike.
- 2024-03-07 · Sponsor · NYC Council – Legistar · ↓ hurts gradeCouncil wants every e-bike and scooter tagged and tracked. Plates on wheels. Riders face new rules. Lawmakers say it’s about order. The bill sits in committee. Streets wait.
- 2025-11-12 · Sponsor · NYC Council – Legistar · ↑ helps gradeCouncil sends robotaxis to committee. Human drivers stay. No licenses until rules. Data, safety, access, insurance. Guardrails before rollout. Pedestrians and cyclists can’t be test dummies.
- 2025-08-14 · Sponsor · NYC Council – Legistar · ↓ hurts gradeInt 1347-2025 orders TLC, NYPD and DOT to cite unlicensed commuter vans and levy maximum fines. It will likely shrink shared rides in transit deserts. Trips will shift to private cars and ride-hail. Pedestrians and cyclists face more exposure on the street.
- 👎 Negative2025-08-14 · Sponsor · NYC Council – Legistar · ↓ hurts gradeInt 1347-2025 orders TLC, NYPD and DOT to use a compliance checklist and levy maximum fines on unlicensed commuter vans. Punitive enforcement may cut informal transit, push riders to cars and ride‑hail, and raise vehicle volumes that endanger pedestrians and cyclists.
- • Neutral2025-08-14 · Sponsor · NYC Council – LegistarCity orders a study of commuter vans. It will count licensed and unlicensed vehicles, map stops, and identify where vans block lanes, bus stops, and crosswalks. The report is to be published and sent to the mayor and council.
- 2025-06-11 · Sponsor · NYC Council – LegistarCouncil bill orders bike and scooter share firms to show road rules at docks and in apps. Riders must review rules yearly. No extra fees. Aim: clear, visible reminders. Committee review underway.
- 2025-06-11 · Sponsor · NYC Council – LegistarCouncil bill orders bike and scooter share firms to show road rules on apps and stations. Riders must review rules yearly. No extra fees. Aim: clear, visible rules for all. Committee review underway.
- 2025-06-11 · Sponsor · NYC Council – Legistar · ↓ hurts gradeCouncil bill aims to slow e-bikes to 15 mph. Sponsors say it will cut risk on crowded streets. The measure now sits with the transportation committee. No vote yet. Vulnerable road users wait.
- 2025-06-11 · Sponsor · NYC Council – LegistarCouncil bill demands bike and scooter share firms post road rules at stations and in apps. Riders must review rules yearly. No charge for time spent reading. City aims for clarity, not confusion.
- 2026-03-26 · Sponsor · NYC Council – Legistar · ↓ hurts gradeInt 0802-2026 moved to the Transportation and Infrastructure Committee. It would force e-bikes, e-scooters, and other legal motorized vehicles onto city rolls, with ID numbers and rear plates.
- 2026-02-24 · Sponsor · NYC Council – Legistar · ↑ helps gradeInt 0704-2026 landed in committee. It would mandate regular ferry service at Canarsie Pier in Brooklyn. A new route. A new rush to the waterfront.
- 2026-02-24 · Sponsor · NYC Council – LegistarNarcisse co-sponsors Canarsie Pier ferry service bill with no safety impact.
- 2026-02-12 · Sponsor · NYC Council – LegistarNarcisse co-sponsors tow pound capacity bill with no clear safety impact
5827 Flatlands Avenue, Brooklyn, NY 11234
718-241-9330
250 Broadway, Suite 1792, New York, NY 10007
212-788-7286
Borough President Antonio Reynoso —
Police Precinct NYPD 63rd Precinct —
Other Geographies See nearby areas
▸ Other Geographies
District 46 Council District 46 sits in Brooklyn, Precinct 63.
It contains Brooklyn CB 18, Brooklyn CB 56, Madison, Sheepshead Bay-Manhattan Beach-Gerritsen Beach, Flatlands, Marine Park-Mill Basin-Bergen Beach, Canarsie, Marine Park-Plumb Island, McGuire Fields, Canarsie Park & Pier, Barren Island-Floyd Bennett Field.
▸ See also
