Council District 49
Crash Narratives
Council District 49 reels after a week of serious injuries
June 1 to June 8 saw 22 crashes in Council District 49, with 4 serious injuries and 13 moderate injuries.
From June 1 to June 8, Council District 49 had 22 crashes and 29 injuries. Four were serious injuries and 13 were moderate injuries, with no deaths. This district has triggered six alerts in 90 days and six in 365 days.
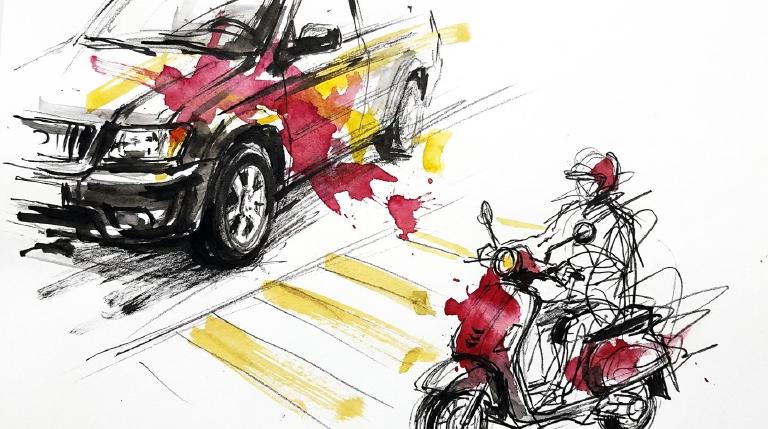
One case shows the pattern. On Forest Avenue at Pelton Avenue, a driver turning left failed to yield and hit an e-scooter rider, ejecting him with a leg fracture or dislocation. Council Member Kamillah Hanks should press DOT for hard turn-calming and safer crossings on these corridors now.
- 22 crashes in last 7 days
- 4 serious injuries
- A driver turning left on Forest Avenue failed to yield and hit a rider on an e-scooter. The 54-year-old man was ejected and injured, with a leg fracture/dislocation.
- Police recorded driver inattention after two sedan drivers collided on Richmond Terrace at Van Name Avenue. A 3-year-old passenger suffered a head injury.
- A driver fell asleep while making a left turn on Tompkins Avenue at School Road. The 20-year-old driver suffered a concussion.
Council District 49: Traffic Crash Statistics
Crash Counter for District 49 660 crashes • 3 deaths
About these crash totals
Counts come from NYC police crash reports (NYPD Motor Vehicle Collisions on NYC Open Data). We sum all crashes, injuries, and deaths for this area across the selected time window shown on the card. Injury severity follows DOT's KABCO definitions mapped from the NYPD Person table (injury status, injury type, and injury location).
- Crashes: number of police‑reported collisions (all road users).
- All injuries: people with any reported injury (KABCO A/B/C or generic "injured").
- Moderate / Serious: suspected minor + suspected serious injuries (KABCO B + A).
- Deaths: killed or apparent death reported by police (KABCO K).
Change badges (arrows and percentages) compare the selected window with the same period last year whenever we have enough history. The “From 2022” view shows totals across the full span since 2022. When a comparison window isn’t available the badge shows an em dash.
Notes: Police reports can be corrected after initial publication. We cannot verify "death within 30 days" or hospital outcomes, so small differences from DOT totals are possible. Minor incidents without a police report are not included.
CloseCaught Speeding in CD 49 KXH2766 — 173 times
- 173 speed-camera tickets citywide in 12 monthsNY KXH2766 · 2022 Gray Kia SedanCaught here 109 times in the last 12 months.Typically speeds citywide in: Tompkinsville-Stapleton-Clifton-Fox Hills (38), Mariner's Harbor-Arlington-Graniteville (33), and West New Brighton-Silver Lake-Grymes Hill (18).
- 165 speed-camera tickets citywide in 12 monthsNJ A35WNJ · 2024 Audi SedaCaught here 2 times in the last 12 months.Typically speeds citywide in: East Flatbush-Remsen Village (17), East Flatbush-Rugby (15), and Crown Heights (North) (14).
- 160 speed-camera tickets citywide in 12 monthsPA MMN1453 · 2021 Gray BMW CpCaught here 2 times in the last 12 months.Typically speeds citywide in: Flatlands (20), Flatbush (16), and East Flatbush-Erasmus (15).
- 149 speed-camera tickets citywide in 12 monthsNY LHW5785 · 2024 Black Toyota SuburbanCaught here 1 time in the last 12 months.Typically speeds citywide in: Crown Heights (North) (14), Bedford-Stuyvesant (West) (12), and Ocean Hill (11).
- 138 speed-camera tickets citywide in 12 monthsNY LWG4456 · 2025 Gray Cadillac SuburbanCaught here 20 times in the last 12 months.Typically speeds citywide in: Annadale-Huguenot-Prince's Bay-Woodrow (38), Great Kills-Eltingville (18), and Grasmere-Arrochar-South Beach-Dongan Hills (14).
About this list
This ranks vehicles caught speeding in this area during the latest 12-month window by the number of NYC school-zone speed-camera violations they received anywhere in the city during that same window.
Camera violations are issued by NYC DOT’s program. Counts reflect issued tickets and may omit dismissed or pending cases. Plate text is shown verbatim as recorded.
CloseDangerous Schools in CD 49 Loading school hotspots...
| School | Crashes
Injuries
Child injuries
Deaths |
|---|
Dangerous Streets in CD 49 Loading street hotspots...
| Street | Crashes
Injuries
Child injuries
Deaths |
|---|
Dangerous Intersections in CD 49 Loading intersection hotspots...
| Intersection | Crashes
Injuries
Child injuries
Deaths |
|---|
Crash Finder
Try Crash Finder
Look up any street, school, address, or intersection to see how safe the streets are.
CD 49 Hot Spots Danger zones and recent crashes
Traffic Safety Timeline Tap to view recent events
Carnage in CD 49 11 Whiplash (Neck)
▸ Killed 3
▸ Crush Injuries 3
▸ Severe Bleeding 1
▸ Concussion 4
▸ Fracture/Dislocation 10
▸ Internal Injury 7
▸ Whiplash 30
▸ Contusion/Bruise 33
▸ Abrasion 20
▸ Pain/Nausea 3
Crashes by Hour in CD 49 2 PM • 32 injuries ↑6.7%
Who is getting hurt? Kids 35 injuries ↑35% Seniors 47 injuries ↑38%
Toggle on at least one mode to see people totals.
Totals count people injured or killed. Use the mode filters above to focus the stacks.
Dangerous Bike Lanes in CD 49 Loading bike lane hotspots...
| Bike lane | Crashes
Cyclist injuries
Child injuries
Cyclist deaths |
|---|
What Crashes Cost Here Loading estimate...
Loading crash cost estimate...
The three blocks below show direct costs, other harm, and the total for crashes with injuries, crashes without injuries, and all crashes together.
How we calculate this
We calculate these costs using a method developed by the National Highway Traffic Safety Administration, or NHTSA. It gives one set of costs for crashes with injuries and another for crashes with no reported injuries.
Crashes with injuries cost much more because the method includes things like lost work, medical care, and long-term harm. NHTSA says crash costs include "lost productivity, medical, legal and court costs, emergency service, insurance administration, congestion, property damage, and workplace losses."
These are estimates, not bills. "Other harm" is the part of the broader estimate that goes beyond direct bills and insurance claims. It captures pain, disability, and lost quality of life.
Download the math (CSV) · Download the math (JSON) · Method and sources
Preventable Speeding 3,832 16+ offenders ↓64%
Repeat School-Zone Speeding Offenders
- ≥ 6: 9,074 (2026 year-to-date) • Prev: 26,087 2025 year-to-date
- ≥ 16: 3,832 (2026 year-to-date) • Prev: 10,732 2025 year-to-date
Pedestrian Injuries 100% by Cars and Trucks ↓8.9%
About this chart
We group pedestrian injuries and deaths by the vehicle type that struck them (as recorded in police reports). Use the year selector to compare the current window with the prior period.
- Trucks/Buses, SUVs/Cars, Mopeds, and Bikes reflect the broad categories we use to track vehicle harm.
- Counts include people on foot only; crashes with no injured pedestrians do not appear in this card.
Notes: Police classification can change during investigations. Small categories may have year-to-year variance.
CloseCouncil Member Kamillah Hanks C (57)
District 49
- 2024-12-19 · Vote · NYC Council – Legistar · ↓ hurts gradeHanks votes yes on bill requiring FDNY consultation for street projects.
- 2024-11-13 · Sponsor · NYC Council – Legistar · ↓ hurts gradeCouncil bill targets shuttered schools. Annual study flags closed sites. Speed cameras pulled from dead zones. Streets lose watchful eyes. Vulnerable walkers and riders left exposed.
- 2024-09-26 · Sponsor · NYC Council – LegistarCouncil bill slashes legal parking time for big rigs. Ninety minutes max for tractor-trailers. Three hours for other commercial trucks. Streets clear faster. Heavy metal moves on.
- 2024-09-26 · Vote · NYC Council – Legistar · ↑ helps gradeCouncil ends jaywalking penalties. Pedestrians now cross anywhere, any time. No summons. Law strips drivers of excuses. Streets shift. Power tilts to people on foot.
- 2024-05-16 · Sponsor · NYC Council – Legistar · ↑ helps gradeCouncil moves to light up step streets. At least 25 stairways each year will get new lamps. Dark paths become visible. Pedestrians gain ground. Shadows shrink. Danger loses its cover.
- 👎 Negative2024-05-16 · Sponsor · NYC Council – Legistar · ↓ hurts gradeCouncil bill targets repeat pedal-assist bike violators. Three strikes trigger a mandatory safety course. Ignore the course, lose your bike. DOT will track results. Three-year pilot. Enforcement, not education, leads.
- 2024-04-18 · Sponsor · NYC Council – Legistar · ↑ helps gradeCouncil orders swift removal of abandoned and unplated cars. Streets clear in 72 hours. Police target vehicles with missing or fake plates. Fewer hazards for those on foot and bike.
- 2024-03-07 · Sponsor · NYC Council – Legistar · ↓ hurts gradeCouncil wants every e-bike and scooter tagged and tracked. Plates on wheels. Riders face new rules. Lawmakers say it’s about order. The bill sits in committee. Streets wait.
- 2025-12-26 · Leadership · Brooklyn Paper · ↑ helps gradeCongestion tolls hit cars hard below 61st. Traffic thinned. Air cleared. Trains shifted. MetroCards died. Riders paid more while streets grew a little safer to walk and ride.
- 2025-07-14 · Sponsor · NYC Council – Legistar · ↓ hurts gradeCouncil bill lets ambulettes drive and double-park in bus lanes. More vehicles in bus lanes mean more risk for people walking, biking, and waiting at curbs. Danger grows where curb chaos reigns.
- 2025-06-30 · Vote · NYC Council – Legistar · ↑ helps gradeCouncil orders swift removal of abandoned, derelict cars. Streets clear in 72 hours. No plates, no stickers, no excuses. Police and sanitation must act. Safer crossings for all who walk, ride, or wait.
- 2025-06-11 · Sponsor · NYC Council – LegistarCouncil bill orders bike and scooter share firms to show road rules at docks and in apps. Riders must review rules yearly. No extra fees. Aim: clear, visible reminders. Committee review underway.
- 2025-06-11 · Sponsor · NYC Council – LegistarCouncil bill orders bike and scooter share firms to show road rules at docks and in apps. Riders must review rules yearly. No extra fees. Aim: clear, visible reminders. Committee review underway.
- 2025-06-11 · Sponsor · NYC Council – LegistarCouncil bill orders bike and scooter share firms to show road rules on apps and stations. Riders must review rules yearly. No extra fees. Aim: clear, visible rules for all. Committee review underway.
- 2025-06-11 · Sponsor · NYC Council – LegistarCouncil bill demands bike and scooter share firms post road rules at stations and in apps. Riders must review rules yearly. No charge for time spent reading. City aims for clarity, not confusion.
- 2025-06-11 · Sponsor · NYC Council – Legistar · ↑ helps gradeHanks co-sponsors bill to create St. George–Bay Ridge ferry service.
- 2026-02-24 · Sponsor · NYC Council – Legistar · ↑ helps gradeInt 0704-2026 landed in committee. It would mandate regular ferry service at Canarsie Pier in Brooklyn. A new route. A new rush to the waterfront.
- 2026-02-24 · Sponsor · NYC Council – LegistarHanks co-sponsors Canarsie Pier ferry service bill with no safety impact.
- 2026-02-12 · Sponsor · NYC Council – LegistarInt 0672-2026 moved to committee. It would cap tractor-trailer and trailer parking at 90 minutes. The curb would turn over faster. Enforcement and signs would decide what changes on the street.
- 2026-02-12 · Sponsor · NYC Council – LegistarInt 0672-2026 would cut long truck parking. Tractor-trailers and similar rigs could stay 90 minutes, not three hours. It sits in the Transportation and Infrastructure Committee.
130 Stuyvesant Place, 6th Floor, Staten Island, NY 10301
718-556-7370
250 Broadway, Suite 1813, New York, NY 10007
212-788-6972
Borough President Vito J. Fossella —
Police Precinct NYPD 120th Precinct —
Other Geographies See nearby areas
▸ Other Geographies
District 49 Council District 49 sits in Staten Island, Precinct 120.
It contains Staten Island CB 1, St. George-New Brighton, Tompkinsville-Stapleton-Clifton-Fox Hills, Rosebank-Shore Acres-Park Hill, West New Brighton-Silver Lake-Grymes Hill, Westerleigh-Castleton Corners, Port Richmond, Mariner's Harbor-Arlington-Graniteville, Snug Harbor, Fort Wadsworth.
▸ See also
