Council District 50
Crash Narratives
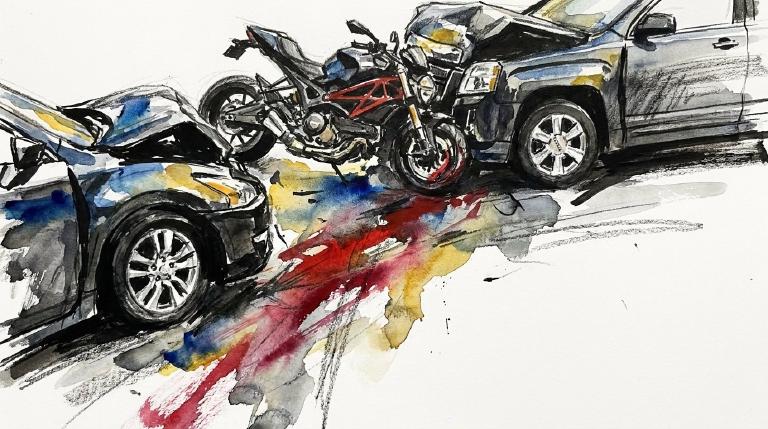
Council District 50 turns deadly on Lily Pond Avenue
June 2 to June 9 saw 3 crashes in Council District 50 with 1 death and 3 serious injuries.
From June 2 through June 9 Council District 50 saw 3 crashes. One person was killed and 3 people suffered serious injuries. On June 9 police logged unsafe speed and improper turning on Lily Pond Avenue. A 34 year old motorcyclist died near Narrows Road S at 10 30 p.m.
That same day police said a driver fell asleep near 1550 Richmond Avenue. On June 3 police cited inattention and prescription medication near 678 Manor Road. This district has triggered 6 alerts in 90 days and 365 days. Council Member David M. Carr can press DOT for speed calming on Lily Pond Avenue.
- 3 crashes in last 7 days
- 3 serious injuries
- 1 death
- Police recorded unsafe speed and improper turning on Lily Pond Avenue. A motorcyclist was killed.
- A driver fell asleep near 1550 Richmond Avenue and hit a parked sedan. Another driver suffered a concussion and chest injury in the morning crash.
- Police recorded driver inattention. A 95-year-old driver went straight on Manor Road and hit a parked sedan, leaving him with a concussion.
Council District 50: Traffic Crash Statistics
Crash Counter for District 50 821 crashes • 3 deaths
About these crash totals
Counts come from NYC police crash reports (NYPD Motor Vehicle Collisions on NYC Open Data). We sum all crashes, injuries, and deaths for this area across the selected time window shown on the card. Injury severity follows DOT's KABCO definitions mapped from the NYPD Person table (injury status, injury type, and injury location).
- Crashes: number of police‑reported collisions (all road users).
- All injuries: people with any reported injury (KABCO A/B/C or generic "injured").
- Moderate / Serious: suspected minor + suspected serious injuries (KABCO B + A).
- Deaths: killed or apparent death reported by police (KABCO K).
Change badges (arrows and percentages) compare the selected window with the same period last year whenever we have enough history. The “From 2022” view shows totals across the full span since 2022. When a comparison window isn’t available the badge shows an em dash.
Notes: Police reports can be corrected after initial publication. We cannot verify "death within 30 days" or hospital outcomes, so small differences from DOT totals are possible. Minor incidents without a police report are not included.
CloseCaught Speeding in CD 50 KXM7078 — 286 times
- 286 speed-camera tickets citywide in 12 monthsNY KXM7078 · 2022 Gray Ford PickupCaught here 1 time in the last 12 months.Typically speeds citywide in: East New York-New Lots (27), Crown Heights (North) (22), and Concourse-Concourse Village (16).
- 196 speed-camera tickets citywide in 12 monthsGA RUN1724 · 2020 Black BMW MpCaught here 1 time in the last 12 months.Typically speeds citywide in: Crown Heights (North) (88), Prospect Heights (19), and Spring Creek-Starrett City (12).
- 173 speed-camera tickets citywide in 12 monthsNY KXH2766 · 2022 Gray Kia SedanCaught here 14 times in the last 12 months.Typically speeds citywide in: Tompkinsville-Stapleton-Clifton-Fox Hills (38), Mariner's Harbor-Arlington-Graniteville (33), and West New Brighton-Silver Lake-Grymes Hill (18).
- 165 speed-camera tickets citywide in 12 monthsNJ A35WNJ · 2024 Audi SedaCaught here 1 time in the last 12 months.Typically speeds citywide in: East Flatbush-Remsen Village (17), East Flatbush-Rugby (15), and Crown Heights (North) (14).
- 160 speed-camera tickets citywide in 12 monthsPA MMN1453 · 2021 Gray BMW CpCaught here 1 time in the last 12 months.Typically speeds citywide in: Flatlands (20), Flatbush (16), and East Flatbush-Erasmus (15).
About this list
This ranks vehicles caught speeding in this area during the latest 12-month window by the number of NYC school-zone speed-camera violations they received anywhere in the city during that same window.
Camera violations are issued by NYC DOT’s program. Counts reflect issued tickets and may omit dismissed or pending cases. Plate text is shown verbatim as recorded.
CloseDangerous Schools in CD 50 Loading school hotspots...
| School | Crashes
Injuries
Child injuries
Deaths |
|---|
Dangerous Streets in CD 50 Loading street hotspots...
| Street | Crashes
Injuries
Child injuries
Deaths |
|---|
Dangerous Intersections in CD 50 Loading intersection hotspots...
| Intersection | Crashes
Injuries
Child injuries
Deaths |
|---|
Crash Finder
Try Crash Finder
Look up any street, school, address, or intersection to see how safe the streets are.
CD 50 Hot Spots Danger zones and recent crashes
Traffic Safety Timeline Tap to view recent events
Carnage in CD 50 13 Whiplash (Neck)
▸ Killed 3
▸ Crush Injuries 3
▸ Severe Lacerations 1
▸ Concussion 8
▸ Fracture/Dislocation 8
▸ Internal Injury 4
▸ Whiplash 29
▸ Contusion/Bruise 26
▸ Abrasion 15
▸ Pain/Nausea 7
Crashes by Hour in CD 50 6 PM • 36 injuries ↓12%
Who is getting hurt? Kids 48 injuries ↓43% Seniors 49 injuries ↓2.0%
Toggle on at least one mode to see people totals.
Totals count people injured or killed. Use the mode filters above to focus the stacks.
Dangerous Bike Lanes in CD 50 Loading bike lane hotspots...
| Bike lane | Crashes
Cyclist injuries
Child injuries
Cyclist deaths |
|---|
What Crashes Cost Here Loading estimate...
Loading crash cost estimate...
The three blocks below show direct costs, other harm, and the total for crashes with injuries, crashes without injuries, and all crashes together.
How we calculate this
We calculate these costs using a method developed by the National Highway Traffic Safety Administration, or NHTSA. It gives one set of costs for crashes with injuries and another for crashes with no reported injuries.
Crashes with injuries cost much more because the method includes things like lost work, medical care, and long-term harm. NHTSA says crash costs include "lost productivity, medical, legal and court costs, emergency service, insurance administration, congestion, property damage, and workplace losses."
These are estimates, not bills. "Other harm" is the part of the broader estimate that goes beyond direct bills and insurance claims. It captures pain, disability, and lost quality of life.
Download the math (CSV) · Download the math (JSON) · Method and sources
Preventable Speeding 5,365 16+ offenders ↓64%
Repeat School-Zone Speeding Offenders
- ≥ 6: 11,755 (2026 year-to-date) • Prev: 34,135 2025 year-to-date
- ≥ 16: 5,365 (2026 year-to-date) • Prev: 14,988 2025 year-to-date
Pedestrian Injuries 98% by Cars and Trucks ↓29%
About this chart
We group pedestrian injuries and deaths by the vehicle type that struck them (as recorded in police reports). Use the year selector to compare the current window with the prior period.
- Trucks/Buses, SUVs/Cars, Mopeds, and Bikes reflect the broad categories we use to track vehicle harm.
- Counts include people on foot only; crashes with no injured pedestrians do not appear in this card.
Notes: Police classification can change during investigations. Small categories may have year-to-year variance.
CloseCouncil Member David M. Carr F (26)
District 50
- 2024-12-19 · Vote · NYC Council – Legistar · ↓ hurts gradeCarr votes yes on bill requiring FDNY consultation for street projects.
- 2024-11-13 · Sponsor · NYC Council – Legistar · ↓ hurts gradeCouncil bill targets shuttered schools. Annual study flags closed sites. Speed cameras pulled from dead zones. Streets lose watchful eyes. Vulnerable walkers and riders left exposed.
- 2024-09-26 · Vote · NYC Council – Legistar · ↓ hurts gradeCouncil ends jaywalking penalties. Pedestrians now cross anywhere, any time. No summons. Law strips drivers of excuses. Streets shift. Power tilts to people on foot.
- • Neutral2024-08-15 · Vote · NYC Council – LegistarCity law now forces DOT to reveal where bikes and scooters go. Streets and bridges, protected or not. Data goes public. Riders’ movement, danger, and safety projects laid bare. No more hiding the facts.
- 2024-03-07 · Sponsor · NYC Council – Legistar · ↓ hurts gradeCouncil wants every e-bike and scooter tagged and tracked. Plates on wheels. Riders face new rules. Lawmakers say it’s about order. The bill sits in committee. Streets wait.
- 2024-02-28 · Sponsor · NYC Council – Legistar · ↑ helps gradeCouncil wants DOT to check 100 speed camera spots a year for raised speed bumps. If possible, bumps go in within a year. DOT must track and report on driver behavior changes. No delay. No loopholes.
- 2024-02-28 · Sponsor · NYC Council – Legistar · ↓ hurts gradeCarr co-sponsors bill requiring FDNY input on street and bike projects.
- 2025-07-14 · Sponsor · NYC Council – LegistarIntroduced bill makes it a misdemeanor to block or physically stop students, staff, or university employees from attending classes or meetings. It targets shoving, blocking entrances, threatening conduct within 15 feet, and property damage. Penalty: up to $1,000 fine or six months jail.
- 2025-06-30 · Vote · NYC Council – Legistar · ↑ helps gradeCouncil orders swift removal of abandoned, derelict cars. Streets clear in 72 hours. No plates, no stickers, no excuses. Police and sanitation must act. Safer crossings for all who walk, ride, or wait.
- 2025-05-01 · Vote · NYC Council – LegistarCouncil passes law. Taxis and for-hire cars must post bold warnings on rear doors. Riders face the message: look for cyclists before swinging the door. A move to cut dooring. City acts. Cyclists stay in the crosshairs.
- 2025-04-10 · Vote · NYC Council – Legistar · ↑ helps gradeCouncil passed a law forcing DOT to post sharp, regular updates on street safety projects. Progress on bike lanes, bus lanes, and signals must go public. No more hiding delays or cost overruns. The city must show its work.
- 2025-02-13 · Vote · NYC Council – Legistar · ↑ helps gradeCouncil orders DOT to repaint pavement lines within five days after resurfacing. Delays must be explained to the public. Clear markings mean fewer deadly gaps for walkers and riders.
- 2025-01-08 · Sponsor · NYC Council – Legistar · ↑ helps gradeCouncil orders DOT to repaint pavement lines within five days after resurfacing. Delays must be explained to the public. Clear markings mean fewer deadly crossings for walkers and riders.
- 2026-03-26 · Sponsor · NYC Council – Legistar · ↓ hurts gradeInt 0802-2026 moved to the Transportation and Infrastructure Committee. It would force e-bikes, e-scooters, and other legal motorized vehicles onto city rolls, with ID numbers and rear plates.
- 2026-03-26 · Sponsor · NYC Council – Legistar · ↓ hurts gradeInt 0802-2026 moved to the Transportation and Infrastructure Committee. It would force e-bikes, e-scooters, and other legal motor devices to register and display rear plates. A new city ID number would follow each ride.
- 2026-03-26 · Sponsor · NYC Council – Legistar · ↓ hurts gradeInt 0802-2026 landed in committee. It would force e-bikes, e-scooters, and other legal motorized devices to register and wear a rear plate. Riders face new fees, tracking, and enforcement.
- 2026-01-29 · Sponsor · NYC Council – Legistar · ↓ hurts gradeInt 0375-2026 moved to committee. It strips bus and bike lane benchmarks from the Streets Master Plan. It also repeals key lane definitions. Targets vanish on paper.
130 Stuyvesant Place, 5th Floor, Staten Island, NY 10301
718-980-1017
250 Broadway, Suite 1553, New York, NY 10007
212-788-6965
Borough President Vito J. Fossella —
Police Precinct NYPD 122nd Precinct —
Other Geographies See nearby areas
▸ Other Geographies
District 50 Council District 50 sits in Staten Island, Precinct 122.
It contains Staten Island CB 2, Staten Island CB 95, Fort Hamilton, Dyker Beach Park, Bath Beach, Westerleigh-Castleton Corners, Grasmere-Arrochar-South Beach-Dongan Hills, New Dorp-Midland Beach, Todt Hill-Emerson Hill-Lighthouse Hill-Manor Heights, New Springville-Willowbrook-Bulls Head-Travis, Freshkills Park (North), Oakwood-Richmondtown, Fort Wadsworth, Hoffman & Swinburne Islands, Miller Field.
▸ See also
