Police Precinct 110
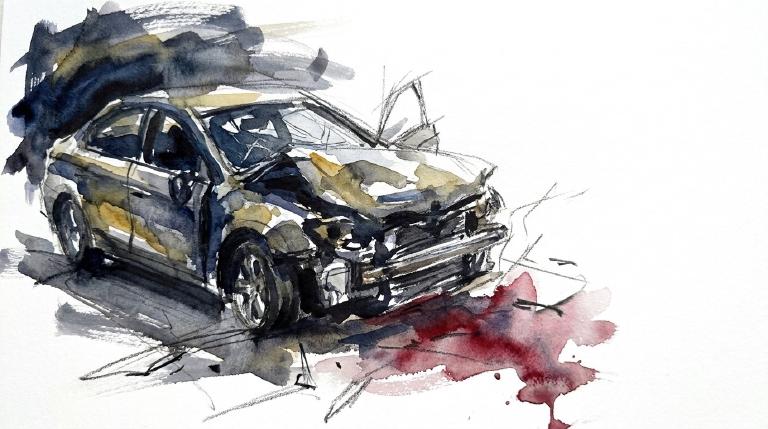
Crash Narratives
Police Precinct 110: Traffic Crash Statistics
Crash Counter for Precinct 110 699 crashes • 4 deaths
About these crash totals
Counts come from NYC police crash reports (NYPD Motor Vehicle Collisions on NYC Open Data). We sum all crashes, injuries, and deaths for this area across the selected time window shown on the card. Injury severity follows DOT's KABCO definitions mapped from the NYPD Person table (injury status, injury type, and injury location).
- Crashes: number of police‑reported collisions (all road users).
- All injuries: people with any reported injury (KABCO A/B/C or generic "injured").
- Moderate / Serious: suspected minor + suspected serious injuries (KABCO B + A).
- Deaths: killed or apparent death reported by police (KABCO K).
Change badges (arrows and percentages) compare the selected window with the same period last year whenever we have enough history. The “From 2022” view shows totals across the full span since 2022. When a comparison window isn’t available the badge shows an em dash.
Notes: Police reports can be corrected after initial publication. We cannot verify "death within 30 days" or hospital outcomes, so small differences from DOT totals are possible. Minor incidents without a police report are not included.
CloseCaught Speeding in Precinct 110 KZF9054 — 191 times
- 191 speed-camera tickets citywide in 12 monthsNY KZF9054 · 2023 Black Mitsubishi SuburbanCaught here 1 time in the last 12 months.Typically speeds citywide in: East New York-New Lots (13), Ocean Hill (11), and Crown Heights (North) (10).
- 158 speed-camera tickets citywide in 12 monthsNY LFB3565 · 2023 Black Chrys SuburbanCaught here 2 times in the last 12 months.Typically speeds citywide in: Crown Heights (North) (15), Bedford-Stuyvesant (West) (14), and East New York (North) (11).
- 136 speed-camera tickets citywide in 12 monthsNY 20918NE · 2023 White Ford VanCaught here 5 times in the last 12 months.Typically speeds citywide in: Bellerose (8), Queens Village (7), and East New York-New Lots (6).
- 135 speed-camera tickets citywide in 12 monthsNY 201BR7 · 2007 White Suzuk MotorcycleCaught here 1 time in the last 12 months.Typically speeds citywide in: Ocean Hill (43), East Flatbush-Remsen Village (21), and Tribeca-Civic Center (17).
- 126 speed-camera tickets citywide in 12 monthsNY LXZ7874 · 2025 Gray Chevrolet PickupCaught here 7 times in the last 12 months.Typically speeds citywide in: College Point (28), East Elmhurst (18), and Whitestone-Beechhurst (14).
About this list
This ranks vehicles caught speeding in this area during the latest 12-month window by the number of NYC school-zone speed-camera violations they received anywhere in the city during that same window.
Camera violations are issued by NYC DOT’s program. Counts reflect issued tickets and may omit dismissed or pending cases. Plate text is shown verbatim as recorded.
CloseDangerous Schools in Precinct 110 Loading school hotspots...
| School | Crashes
Injuries
Child injuries
Deaths |
|---|
Dangerous Streets in Precinct 110 Loading street hotspots...
| Street | Crashes
Injuries
Child injuries
Deaths |
|---|
Dangerous Intersections in Precinct 110 Loading intersection hotspots...
| Intersection | Crashes
Injuries
Child injuries
Deaths |
|---|
Crash Finder
Try Crash Finder
Look up any street, school, address, or intersection to see how safe the streets are.
Precinct 110 Hot Spots Danger zones and recent crashes
Traffic Safety Timeline Tap to view recent events
Carnage in Precinct 110 11 Whiplash (Neck)
▸ Killed 4
▸ Crush Injuries 1
▸ Concussion 2
▸ Fracture/Dislocation 2
▸ Whiplash 17
▸ Contusion/Bruise 22
▸ Abrasion 5
▸ Pain/Nausea 3
Crashes by Hour in Precinct 110 2 PM • 31 injuries ↑41%
Who is getting hurt? Kids 50 injuries ↑127% Seniors 32 injuries ↑23%
Toggle on at least one mode to see people totals.
Totals count people injured or killed. Use the mode filters above to focus the stacks.
Dangerous Bike Lanes in Precinct 110 Loading bike lane hotspots...
| Bike lane | Crashes
Cyclist injuries
Child injuries
Cyclist deaths |
|---|
What Crashes Cost Here Loading estimate...
Loading crash cost estimate...
The three blocks below show direct costs, other harm, and the total for crashes with injuries, crashes without injuries, and all crashes together.
How we calculate this
We calculate these costs using a method developed by the National Highway Traffic Safety Administration, or NHTSA. It gives one set of costs for crashes with injuries and another for crashes with no reported injuries.
Crashes with injuries cost much more because the method includes things like lost work, medical care, and long-term harm. NHTSA says crash costs include "lost productivity, medical, legal and court costs, emergency service, insurance administration, congestion, property damage, and workplace losses."
These are estimates, not bills. "Other harm" is the part of the broader estimate that goes beyond direct bills and insurance claims. It captures pain, disability, and lost quality of life.
Download the math (CSV) · Download the math (JSON) · Method and sources
Preventable Speeding 590 16+ offenders ↓71%
Repeat School-Zone Speeding Offenders
- ≥ 6: 1,486 (2026 year-to-date) • Prev: 4,846 2025 year-to-date
- ≥ 16: 590 (2026 year-to-date) • Prev: 2,006 2025 year-to-date
Pedestrian Injuries 97% by Cars and Trucks ↑5.9%
About this chart
We group pedestrian injuries and deaths by the vehicle type that struck them (as recorded in police reports). Use the year selector to compare the current window with the prior period.
- Trucks/Buses, SUVs/Cars, Mopeds, and Bikes reflect the broad categories we use to track vehicle harm.
- Counts include people on foot only; crashes with no injured pedestrians do not appear in this card.
Notes: Police classification can change during investigations. Small categories may have year-to-year variance.
ClosePolice Precinct NYPD 110th Precinct —
Borough President Donovan Richards Jr. —
Other Geographies See nearby areas
▸ Other Geographies
Precinct 110 Police Precinct 110 sits in Queens.
It contains Queens CB 4, Queens CB 81, Elmhurst, Corona, Flushing Meadows-Corona Park.
▸ See also
