Police Precinct 112
Crash Narratives
Precinct 112 turns rough in seven days
Police Precinct 112 saw 14 crashes in seven days. Twenty three people were hurt. Two had serious injuries. This is the second alert here in 90 days.
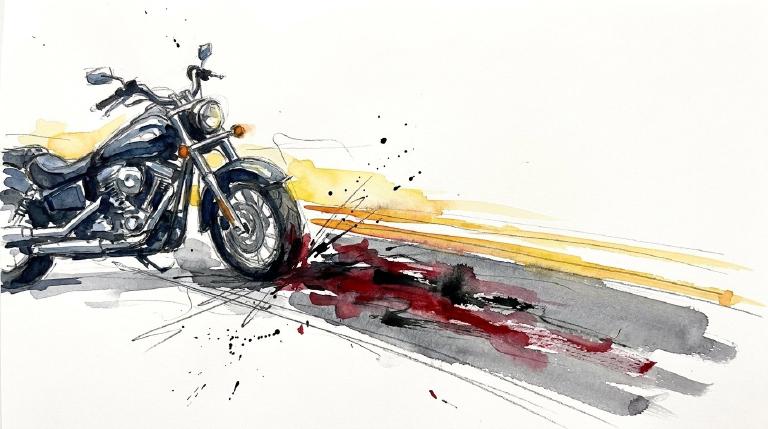
Police Precinct 112 had 14 crashes from June 2 through June 9. Twenty three people were injured in that span. Two people had serious injuries and nine had moderate injuries. One rider on the Long Island Expressway was left semiconscious with a head injury.
This precinct has triggered one other alert in the past 90 days. It has also triggered one alert in the past year. The same streets keep paying the price. The NYPD 112th Precinct can answer with sustained speeding and failure to yield enforcement.
- 14 crashes in last 7 days
- 2 serious injuries
- A motorcycle rider ended up semiconscious with a head injury on the Long Island Expressway. Police recorded passing too closely.
- Late night on Woodhaven Boulevard, police recorded driver inexperience as two drivers crashed. A 19-year-old front passenger suffered a concussion; a 58-year-old driver reported back pain and nausea.
- Police recorded driver inattention after a driver hit a Yamaha moped on the Grand Central Parkway/Long Island Expressway connector. The 21-year-old rider reported a neck bruise.
Police Precinct 112: Traffic Crash Statistics
Crash Counter for Precinct 112 462 crashes • 1 deaths
About these crash totals
Counts come from NYC police crash reports (NYPD Motor Vehicle Collisions on NYC Open Data). We sum all crashes, injuries, and deaths for this area across the selected time window shown on the card. Injury severity follows DOT's KABCO definitions mapped from the NYPD Person table (injury status, injury type, and injury location).
- Crashes: number of police‑reported collisions (all road users).
- All injuries: people with any reported injury (KABCO A/B/C or generic "injured").
- Moderate / Serious: suspected minor + suspected serious injuries (KABCO B + A).
- Deaths: killed or apparent death reported by police (KABCO K).
Change badges (arrows and percentages) compare the selected window with the same period last year whenever we have enough history. The “From 2022” view shows totals across the full span since 2022. When a comparison window isn’t available the badge shows an em dash.
Notes: Police reports can be corrected after initial publication. We cannot verify "death within 30 days" or hospital outcomes, so small differences from DOT totals are possible. Minor incidents without a police report are not included.
CloseCaught Speeding in Precinct 112 KXM7078 — 286 times
- 286 speed-camera tickets citywide in 12 monthsNY KXM7078 · 2022 Gray Ford PickupCaught here 5 times in the last 12 months.Typically speeds citywide in: East New York-New Lots (27), Crown Heights (North) (22), and Concourse-Concourse Village (16).
- 196 speed-camera tickets citywide in 12 monthsGA RUN1724 · 2020 Black BMW MpCaught here 1 time in the last 12 months.Typically speeds citywide in: Crown Heights (North) (88), Prospect Heights (19), and Spring Creek-Starrett City (12).
- 191 speed-camera tickets citywide in 12 monthsNY KZF9054 · 2023 Black Mitsubishi SuburbanCaught here 4 times in the last 12 months.Typically speeds citywide in: East New York-New Lots (13), Ocean Hill (11), and Crown Heights (North) (10).
- 178 speed-camera tickets citywide in 12 monthsNY KXM8750 · 2023 Black Mitsubishi SuburbanCaught here 1 time in the last 12 months.Typically speeds citywide in: St. Albans (23), South Jamaica (16), and Laurelton (15).
- 176 speed-camera tickets citywide in 12 monthsGA SGY7043 · 2021 White Mercedes-Benz 4SCaught here 2 times in the last 12 months.Typically speeds citywide in: Canarsie (51), Sheepshead Bay-Manhattan Beach-Gerritsen Beach (19), and Baisley Park (14).
About this list
This ranks vehicles caught speeding in this area during the latest 12-month window by the number of NYC school-zone speed-camera violations they received anywhere in the city during that same window.
Camera violations are issued by NYC DOT’s program. Counts reflect issued tickets and may omit dismissed or pending cases. Plate text is shown verbatim as recorded.
CloseDangerous Schools in Precinct 112 Loading school hotspots...
| School | Crashes
Injuries
Child injuries
Deaths |
|---|
Dangerous Streets in Precinct 112 Loading street hotspots...
| Street | Crashes
Injuries
Child injuries
Deaths |
|---|
Dangerous Intersections in Precinct 112 Loading intersection hotspots...
| Intersection | Crashes
Injuries
Child injuries
Deaths |
|---|
Crash Finder
Try Crash Finder
Look up any street, school, address, or intersection to see how safe the streets are.
Precinct 112 Hot Spots Danger zones and recent crashes
Traffic Safety Timeline Tap to view recent events
Carnage in Precinct 112 6 Contusion/Bruise (Lower leg/foot)
▸ Killed 1
▸ Crush Injuries 2
▸ Severe Bleeding 1
▸ Concussion 2
▸ Internal Injury 3
▸ Whiplash 14
▸ Contusion/Bruise 17
▸ Abrasion 3
▸ Pain/Nausea 1
Crashes by Hour in Precinct 112 1 PM • 18 injuries ↑350%
Who is getting hurt? Kids 20 injuries ↓4.8% Seniors 22 injuries ↑29%
Toggle on at least one mode to see people totals.
Totals count people injured or killed. Use the mode filters above to focus the stacks.
Dangerous Bike Lanes in Precinct 112 Loading bike lane hotspots...
| Bike lane | Crashes
Cyclist injuries
Child injuries
Cyclist deaths |
|---|
What Crashes Cost Here Loading estimate...
Loading crash cost estimate...
The three blocks below show direct costs, other harm, and the total for crashes with injuries, crashes without injuries, and all crashes together.
How we calculate this
We calculate these costs using a method developed by the National Highway Traffic Safety Administration, or NHTSA. It gives one set of costs for crashes with injuries and another for crashes with no reported injuries.
Crashes with injuries cost much more because the method includes things like lost work, medical care, and long-term harm. NHTSA says crash costs include "lost productivity, medical, legal and court costs, emergency service, insurance administration, congestion, property damage, and workplace losses."
These are estimates, not bills. "Other harm" is the part of the broader estimate that goes beyond direct bills and insurance claims. It captures pain, disability, and lost quality of life.
Download the math (CSV) · Download the math (JSON) · Method and sources
Preventable Speeding 1,337 16+ offenders ↓69%
Repeat School-Zone Speeding Offenders
- ≥ 6: 3,118 (2026 year-to-date) • Prev: 9,505 2025 year-to-date
- ≥ 16: 1,337 (2026 year-to-date) • Prev: 4,297 2025 year-to-date
Pedestrian Injuries 100% by Cars and Trucks ↓6.8%
About this chart
We group pedestrian injuries and deaths by the vehicle type that struck them (as recorded in police reports). Use the year selector to compare the current window with the prior period.
- Trucks/Buses, SUVs/Cars, Mopeds, and Bikes reflect the broad categories we use to track vehicle harm.
- Counts include people on foot only; crashes with no injured pedestrians do not appear in this card.
Notes: Police classification can change during investigations. Small categories may have year-to-year variance.
ClosePolice Precinct NYPD 112th Precinct —
Borough President Donovan Richards Jr. —
Other Geographies See nearby areas
▸ Other Geographies
Precinct 112 Police Precinct 112 sits in Queens.
It contains Queens CB 6, Rego Park, Forest Hills.
▸ See also
