Police Precinct 42
Crash Narratives
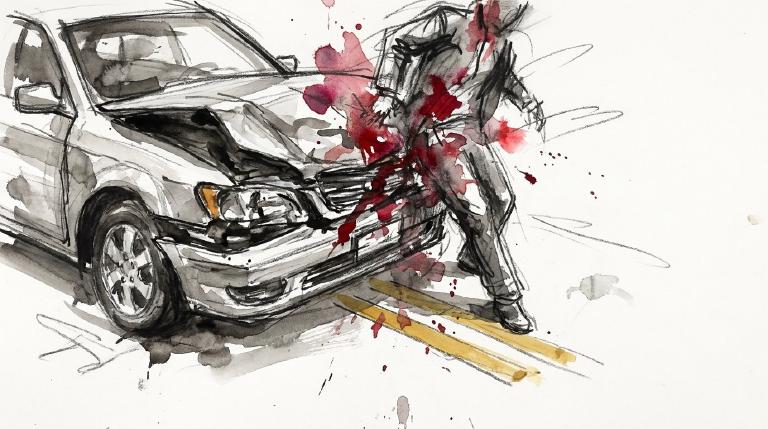
Precinct 42 turns loud on Boston Road
Police Precinct 42 saw 3 crashes and 3 serious injuries in 7 days. A pedestrian on Boston Road took severe lacerations. A motorcyclist lost part of a leg.
Police Precinct 42 was normally quiet. It broke open from May 28 to June 4. Three crashes left three people seriously injured.
On June 2 a driver hit a 38-year-old woman crossing near 1624 Boston Road. Police recorded severe lacerations. On June 4 a right turn on Boston Road at East 169th Street hit a 62-year-old motorcyclist. Police recorded an amputation and leg trauma. This precinct has set off one other alert in 90 days and 365 days. Push leaders in Police Precinct 42 to fix the dangerous streets.
- 3 crashes in last 7 days
- 3 serious injuries
- A sedan driver turned right on Boston Road and hit a motorcyclist. The 62-year-old rider lost part of a leg.
- A driver in a sedan hit a 38-year-old woman as she crossed near 1624 Boston Road. Police recorded severe lacerations.
- A driver crashed on E 161st Street at Melrose Avenue and got thrown from the vehicle. Police recorded severe lacerations and a knee/lower-leg/foot injury.
Police Precinct 42: Traffic Crash Statistics
Crash Counter for Precinct 42 344 crashes • 1 deaths
About these crash totals
Counts come from NYC police crash reports (NYPD Motor Vehicle Collisions on NYC Open Data). We sum all crashes, injuries, and deaths for this area across the selected time window shown on the card. Injury severity follows DOT's KABCO definitions mapped from the NYPD Person table (injury status, injury type, and injury location).
- Crashes: number of police‑reported collisions (all road users).
- All injuries: people with any reported injury (KABCO A/B/C or generic "injured").
- Moderate / Serious: suspected minor + suspected serious injuries (KABCO B + A).
- Deaths: killed or apparent death reported by police (KABCO K).
Change badges (arrows and percentages) compare the selected window with the same period last year whenever we have enough history. The “From 2022” view shows totals across the full span since 2022. When a comparison window isn’t available the badge shows an em dash.
Notes: Police reports can be corrected after initial publication. We cannot verify "death within 30 days" or hospital outcomes, so small differences from DOT totals are possible. Minor incidents without a police report are not included.
CloseCaught Speeding in Precinct 42 KXM7078 — 286 times
- 286 speed-camera tickets citywide in 12 monthsNY KXM7078 · 2022 Gray Ford PickupCaught here 19 times in the last 12 months.Typically speeds citywide in: East New York-New Lots (27), Crown Heights (North) (22), and Concourse-Concourse Village (16).
- 240 speed-camera tickets citywide in 12 monthsNY KWC3138 · 2022 Gray Mitsubishi SuburbanCaught here 28 times in the last 12 months.Typically speeds citywide in: Mount Hope (24), Fordham Heights (18), and Bedford Park (17).
- 206 speed-camera tickets citywide in 12 monthsNY LHW5598 · 2023 Black Toyota SedanCaught here 30 times in the last 12 months.Typically speeds citywide in: Mount Hope (23), Fordham Heights (17), and Claremont Village-Claremont (East) (14).
- 191 speed-camera tickets citywide in 12 monthsNY KZF9054 · 2023 Black Mitsubishi SuburbanCaught here 4 times in the last 12 months.Typically speeds citywide in: East New York-New Lots (13), Ocean Hill (11), and Crown Heights (North) (10).
- 178 speed-camera tickets citywide in 12 monthsNY KXM8750 · 2023 Black Mitsubishi SuburbanCaught here 4 times in the last 12 months.Typically speeds citywide in: St. Albans (23), South Jamaica (16), and Laurelton (15).
About this list
This ranks vehicles caught speeding in this area during the latest 12-month window by the number of NYC school-zone speed-camera violations they received anywhere in the city during that same window.
Camera violations are issued by NYC DOT’s program. Counts reflect issued tickets and may omit dismissed or pending cases. Plate text is shown verbatim as recorded.
CloseDangerous Schools in Precinct 42 Loading school hotspots...
| School | Crashes
Injuries
Child injuries
Deaths |
|---|
Dangerous Streets in Precinct 42 Loading street hotspots...
| Street | Crashes
Injuries
Child injuries
Deaths |
|---|
Dangerous Intersections in Precinct 42 Loading intersection hotspots...
| Intersection | Crashes
Injuries
Child injuries
Deaths |
|---|
Crash Finder
Try Crash Finder
Look up any street, school, address, or intersection to see how safe the streets are.
Precinct 42 Hot Spots Danger zones and recent crashes
Traffic Safety Timeline Tap to view recent events
Carnage in Precinct 42 7 Fracture/Dislocation (Lower leg/foot)
▸ Killed 1
▸ Crush Injuries 1
▸ Amputation 1
▸ Severe Bleeding 1
▸ Severe Lacerations 2
▸ Concussion 2
▸ Fracture/Dislocation 9
▸ Internal Injury 2
▸ Whiplash 11
▸ Contusion/Bruise 7
▸ Abrasion 4
▸ Pain/Nausea 3
Crashes by Hour in Precinct 42 6 PM • 24 injuries ↑200%
Who is getting hurt? Kids 25 injuries ↓3.8% Seniors 16 injuries →0%
Toggle on at least one mode to see people totals.
Totals count people injured or killed. Use the mode filters above to focus the stacks.
Dangerous Bike Lanes in Precinct 42 Loading bike lane hotspots...
| Bike lane | Crashes
Cyclist injuries
Child injuries
Cyclist deaths |
|---|
What Crashes Cost Here Loading estimate...
Loading crash cost estimate...
The three blocks below show direct costs, other harm, and the total for crashes with injuries, crashes without injuries, and all crashes together.
How we calculate this
We calculate these costs using a method developed by the National Highway Traffic Safety Administration, or NHTSA. It gives one set of costs for crashes with injuries and another for crashes with no reported injuries.
Crashes with injuries cost much more because the method includes things like lost work, medical care, and long-term harm. NHTSA says crash costs include "lost productivity, medical, legal and court costs, emergency service, insurance administration, congestion, property damage, and workplace losses."
These are estimates, not bills. "Other harm" is the part of the broader estimate that goes beyond direct bills and insurance claims. It captures pain, disability, and lost quality of life.
Download the math (CSV) · Download the math (JSON) · Method and sources
Preventable Speeding 386 16+ offenders ↓72%
Repeat School-Zone Speeding Offenders
- ≥ 6: 954 (2026 year-to-date) • Prev: 3,494 2025 year-to-date
- ≥ 16: 386 (2026 year-to-date) • Prev: 1,378 2025 year-to-date
Pedestrian Injuries 98% by Cars and Trucks ↓14%
About this chart
We group pedestrian injuries and deaths by the vehicle type that struck them (as recorded in police reports). Use the year selector to compare the current window with the prior period.
- Trucks/Buses, SUVs/Cars, Mopeds, and Bikes reflect the broad categories we use to track vehicle harm.
- Counts include people on foot only; crashes with no injured pedestrians do not appear in this card.
Notes: Police classification can change during investigations. Small categories may have year-to-year variance.
ClosePolice Precinct NYPD 42nd Precinct —
Borough President Vanessa L. Gibson —
Other Geographies See nearby areas
▸ Other Geographies
Precinct 42 Police Precinct 42 sits in Bronx.
It contains Bronx CB 3, Morrisania, Claremont Village-Claremont (East), Crotona Park East, Crotona Park.
▸ See also
