Senate District 26
Crash Narratives
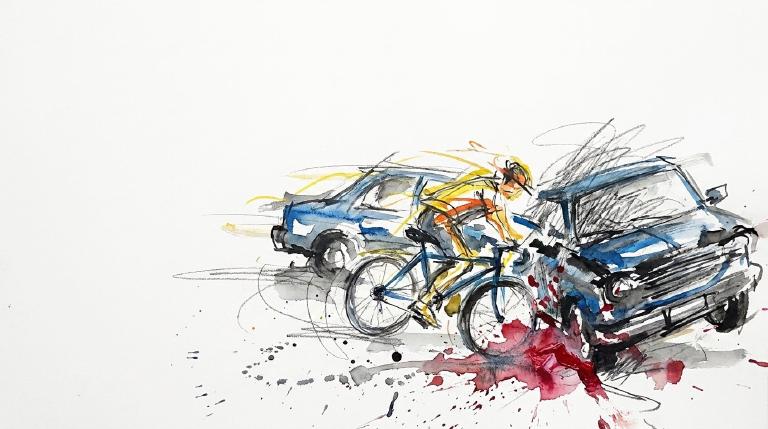
Two boys hit on 4th Ave as Senate District 26 turns violent
Senate District 26 saw 6 crashes in 7 days. Six people suffered serious injuries. A driver hit two boys on an e bike on 4th Avenue near 65th Street.
From May 29 through June 5 Senate District 26 had 6 crashes. Six people suffered serious injuries. On June 4 a driver hit two boys on an e bike on 4th Avenue near 65th Street. Police logged failure to yield right of way.
This district has triggered 12 times in 90 days. It has triggered 12 times in 365 days. State Senator Andrew Gounardes can push bills that curb repeat speeding like S 4045 on intelligent speed assistance.
- 6 crashes in last 7 days
- 6 serious injuries
- A driver going straight on 4th Avenue hit an e-bike carrying two boys, 12 and 13, near 65th Street. Police recorded failure to yield right-of-way and pedestrian/bicyclist error/confusion.
- Police say a distracted driver hit two pedestrians near Flatbush Avenue Ext and Tillary Street. A 58-year-old man reported leg pain and nausea; a 36-year-old woman had bleeding and an arm injury.
- On Jay Street, an SUV driver making a left turn hit a 31-year-old cyclist. Police recorded obstructed or limited view; the rider was ejected and suffered a fractured or dislocated arm.
Senate District 26: Traffic Crash Statistics
Crash Counter for SD 26 1,685 crashes • 5 deaths
About these crash totals
Counts come from NYC police crash reports (NYPD Motor Vehicle Collisions on NYC Open Data). We sum all crashes, injuries, and deaths for this area across the selected time window shown on the card. Injury severity follows DOT's KABCO definitions mapped from the NYPD Person table (injury status, injury type, and injury location).
- Crashes: number of police‑reported collisions (all road users).
- All injuries: people with any reported injury (KABCO A/B/C or generic "injured").
- Moderate / Serious: suspected minor + suspected serious injuries (KABCO B + A).
- Deaths: killed or apparent death reported by police (KABCO K).
Change badges (arrows and percentages) compare the selected window with the same period last year whenever we have enough history. The “From 2022” view shows totals across the full span since 2022. When a comparison window isn’t available the badge shows an em dash.
Notes: Police reports can be corrected after initial publication. We cannot verify "death within 30 days" or hospital outcomes, so small differences from DOT totals are possible. Minor incidents without a police report are not included.
CloseCaught Speeding in SD 26 KXM7078 — 286 times
- 286 speed-camera tickets citywide in 12 monthsNY KXM7078 · 2022 Gray Ford PickupCaught here 2 times in the last 12 months.Typically speeds citywide in: East New York-New Lots (27), Crown Heights (North) (22), and Concourse-Concourse Village (16).
- 196 speed-camera tickets citywide in 12 monthsGA RUN1724 · 2020 Black BMW MpCaught here 3 times in the last 12 months.Typically speeds citywide in: Crown Heights (North) (88), Prospect Heights (19), and Spring Creek-Starrett City (12).
- 191 speed-camera tickets citywide in 12 monthsNY KZF9054 · 2023 Black Mitsubishi SuburbanCaught here 4 times in the last 12 months.Typically speeds citywide in: East New York-New Lots (13), Ocean Hill (11), and Crown Heights (North) (10).
- 176 speed-camera tickets citywide in 12 monthsGA SGY7043 · 2021 White Mercedes-Benz 4SCaught here 2 times in the last 12 months.Typically speeds citywide in: Canarsie (51), Sheepshead Bay-Manhattan Beach-Gerritsen Beach (19), and Baisley Park (14).
- 174 speed-camera tickets citywide in 12 monthsNY LHW6019 · 2024 Gray Toyota SedanCaught here 4 times in the last 12 months.Typically speeds citywide in: Crown Heights (North) (14), Ocean Hill (10), and East New York-New Lots (8).
About this list
This ranks vehicles caught speeding in this area during the latest 12-month window by the number of NYC school-zone speed-camera violations they received anywhere in the city during that same window.
Camera violations are issued by NYC DOT’s program. Counts reflect issued tickets and may omit dismissed or pending cases. Plate text is shown verbatim as recorded.
CloseDangerous Schools in SD 26 Loading school hotspots...
| School | Crashes
Injuries
Child injuries
Deaths |
|---|
Dangerous Streets in SD 26 Loading street hotspots...
| Street | Crashes
Injuries
Child injuries
Deaths |
|---|
Dangerous Intersections in SD 26 Loading intersection hotspots...
| Intersection | Crashes
Injuries
Child injuries
Deaths |
|---|
Crash Finder
Try Crash Finder
Look up any street, school, address, or intersection to see how safe the streets are.
SD 26 Hot Spots Danger zones and recent crashes
Traffic Safety Timeline Tap to view recent events
Carnage in SD 26 22 Whiplash (Neck)
▸ Killed 5
▸ Crush Injuries 3
▸ Severe Bleeding 5
▸ Severe Lacerations 3
▸ Concussion 10
▸ Fracture/Dislocation 8
▸ Internal Injury 9
▸ Whiplash 63
▸ Contusion/Bruise 64
▸ Abrasion 15
▸ Pain/Nausea 31
Crashes by Hour in SD 26 4 PM • 64 injuries ↑8.5%
Who is getting hurt? Kids 56 injuries ↓14% Seniors 49 injuries ↓5.8%
Toggle on at least one mode to see people totals.
Totals count people injured or killed. Use the mode filters above to focus the stacks.
Dangerous Bike Lanes in SD 26 Loading bike lane hotspots...
| Bike lane | Crashes
Cyclist injuries
Child injuries
Cyclist deaths |
|---|
What Crashes Cost Here Loading estimate...
Loading crash cost estimate...
The three blocks below show direct costs, other harm, and the total for crashes with injuries, crashes without injuries, and all crashes together.
How we calculate this
We calculate these costs using a method developed by the National Highway Traffic Safety Administration, or NHTSA. It gives one set of costs for crashes with injuries and another for crashes with no reported injuries.
Crashes with injuries cost much more because the method includes things like lost work, medical care, and long-term harm. NHTSA says crash costs include "lost productivity, medical, legal and court costs, emergency service, insurance administration, congestion, property damage, and workplace losses."
These are estimates, not bills. "Other harm" is the part of the broader estimate that goes beyond direct bills and insurance claims. It captures pain, disability, and lost quality of life.
Download the math (CSV) · Download the math (JSON) · Method and sources
Preventable Speeding 4,368 16+ offenders ↓68%
Repeat School-Zone Speeding Offenders
- ≥ 6: 10,849 (2026 year-to-date) • Prev: 32,320 2025 year-to-date
- ≥ 16: 4,368 (2026 year-to-date) • Prev: 13,635 2025 year-to-date
Pedestrian Injuries 97% by Cars and Trucks →0%
About this chart
We group pedestrian injuries and deaths by the vehicle type that struck them (as recorded in police reports). Use the year selector to compare the current window with the prior period.
- Trucks/Buses, SUVs/Cars, Mopeds, and Bikes reflect the broad categories we use to track vehicle harm.
- Counts include people on foot only; crashes with no injured pedestrians do not appear in this card.
Notes: Police classification can change during investigations. Small categories may have year-to-year variance.
CloseState Senator Andrew Gounardes B (76)
District 26
- 2022-12-14 · Leadership · gothamist.com · ↓ hurts gradeDrivers hide plates. Cameras miss them. Streets stay dangerous. Senator Gounardes pushes a bill to pay citizens for reporting illegal plates. Police claim action, but advocates see little change. The bill sits in committee. Ghost cars keep rolling.
- 2022-12-01 · Leadership · Streetsblog NYC · ↑ helps gradePolice arrested Adam White for removing plastic from a hidden plate. Charges dropped. Council Member Restler pushes Int. 501: fines for blocking lanes, rewards for civilian reporting. Politicians call for accountability. Defaced plates shield reckless drivers. Streets stay dangerous.
- 2022-11-17 · Leadership · Streetsblog NYC · ↑ helps gradeLawmakers and advocates rallied in Manhattan. They demanded more money for the MTA. They want six-minute bus and subway service. They warned against service cuts and fare hikes. They called for gas tax revenue to fund transit. Riders need safe, frequent service.
- 2022-10-21 · Leadership · brooklynpaper.com · ↑ helps gradeCouncilmember Restler and Brooklyn leaders want DOT to flip Bond Street’s traffic northbound after Schermerhorn’s redesign. Locals face gridlock. Community Board 2 backs the move. They demand DOT protect the Bond Street bike lane with a physical barrier.
- 2022-06-06 · Leadership · streetsblog.org · ↑ helps gradeAlbany lawmakers extended 24/7 speed cameras but stalled on key safety bills. Local control over speed limits failed. Some progress, much disappointment. Vulnerable road users remain exposed. Council Member Adrienne Adams was mentioned. The fight for safer streets continues.
- 2022-06-06 · Leadership · Streetsblog NYC · ↑ helps gradeAlbany extended 24/7 school-zone speed cameras for three years. Lawmakers failed to pass Sammy’s Law and other vital safety bills. Advocates called the session a partial victory, but vulnerable road users remain at risk. Progress, but not enough. Streets stay dangerous.
- 2022-06-01 · Leadership · amny.com · ↑ helps gradeState Senate passed bill to run speed cameras all day, every day. The vote was 51 to 12. Cameras now catch speeders at night and on weekends. Most deaths happen off-hours. Expansion aims to cut deadly crashes citywide.
- 2022-06-01 · Leadership · Streetsblog NYC · ↑ helps gradeThe State Senate backed Sen. Gounardes’s bill to run speed cameras nonstop in city school zones. The vote was 51-12. Supporters cited lives lost to speeding. Opponents called it a cash grab. The Assembly must act before the session ends.
- 2023-12-31 · Leadership · NYC Council – Legistar · ↑ helps gradeCouncil backs harsher penalties for drivers who hide plates. Obscured tags let reckless motorists dodge cameras and tickets. The bill aims to stop evasion and protect people on city streets.
- 2023-12-20 · Leadership · NYC Council – Legistar · ↑ helps gradeCouncil backs harsher penalties for drivers who hide plates. Obscured tags let reckless motorists dodge cameras and tickets. The bill aims to stop evasion and protect people on city streets.
- 2023-12-20 · Leadership · NYC Council – Legistar · ↑ helps gradeCouncil backs harsher penalties for drivers who hide plates. Obscured tags let reckless motorists dodge cameras and tickets. The bill aims to stop evasion and protect people on city streets.
- 2023-12-20 · Leadership · NYC Council – Legistar · ↑ helps gradeCouncil backs harsher penalties for drivers who hide plates. Obscured tags let reckless motorists dodge cameras and tickets. The bill aims to stop evasion and protect people on city streets.
- 2023-06-08 · Leadership · Streetsblog NYC · ↑ helps gradeSammy’s Law would let New York City drop speed limits to 20 mph on deadly streets. Council Member Gutierrez led the charge. Brooks-Powers joined. Streets scarred by crashes and deaths. Lower speeds mean fewer bodies broken. The city waits. Lives hang in the balance.
- 2023-06-08 · Vote · Open States · ↑ helps gradeAlbany gets speed cameras near schools. Lawmakers pass A 7043. Cameras catch drivers who endanger kids. The program runs until 2028. Streets near schools face new watchful eyes.
- 2023-06-06 · Vote · Open States · ↑ helps gradeAlbany gets speed cameras near schools. Lawmakers pass A 7043. Cameras catch drivers who endanger kids. The program runs until 2028. Streets near schools face new watchful eyes.
- 2023-06-01 · Vote · Open States · ↑ helps gradeSenate passes S 6808. The bill creates first responder safety zones. It sets speed limits in these zones. Lawmakers act after crashes and close calls. The vote is strong. The danger is real. The streets demand change.
- 2024-12-03 · Leadership · amny.com · ↑ helps gradeMTA’s congestion pricing plan splits New Yorkers. Council Member Holden calls it betrayal. Poll shows narrow support. Some see a cash grab, others hope for better transit. The $9 fee hits drivers. The city waits for the impact.
- 2024-11-25 · Leadership · brooklynpaper.com · ↑ helps gradeBay Ridge’s parks and promenade get $30 million for repairs and upgrades. Community Board 10 approves. New lighting, wider paths, and more green space promised. Council Member Justin Brannan funds and supports. Cyclists and pedestrians get safer, smoother routes. No timeline yet.
- 2024-11-08 · Leadership · streetsblog.org · ↑ helps gradeGovernor Hochul cuts the congestion toll to $9. The move aims to beat a Trump block. Experts warn the lower fee will not cut traffic like the original $15 plan. Urgency grows as the MTA stalls projects. Vulnerable road users wait for relief.
- 2024-11-08 · Leadership · Streetsblog NYC · ↓ hurts gradeGovernor Hochul slashes NYC’s congestion toll to $9. The move aims to beat a federal block but guts traffic reduction. Streets will see less relief. The plan leaves vulnerable road users exposed. The city trades speed and safety for political timing.
- 2024-06-07 · Leadership · nypost.com · ↑ helps gradeAlbany lawmakers shut down a last-ditch MTA funding plan after Governor Hochul paused congestion pricing. No replacement for the lost $1 billion. Transit riders and street users face uncertainty. Lawmakers call the move reckless. The city waits. Danger lingers.
- 2024-06-07 · Vote · Open States · ↑ helps gradeSenate backs S 9752. Mt. Vernon gets green light for up to 20 school speed zones. Law aims to slow cars near kids. Most senators vote yes. A few say no. Streets may change. Danger remains for the young.
- 2024-06-07 · Vote · Open States · ↑ helps gradeSenate backs S 9752. Mt. Vernon gets green light for up to 20 school speed zones. Law aims to slow cars near kids. Most senators vote yes. A few say no. Streets may change. Danger remains for the young.
- 2024-06-06 · Vote · Open States · ↑ helps gradeLawmakers back speed cameras near Kingston schools. Cameras catch drivers who speed. The bill passed both chambers. It sunsets in 2029. Children and families walk safer, but the fix is temporary.
- 2025-12-29 · Leadership · Streetsblog NYC · ↓ hurts gradeStreetsblog hands out sharp awards. They name names. They count broken promises and broken bodies. The targets are drivers, dodging pols, and dozing agencies.
- 2025-11-24 · Leadership · Streetsblog NYC · ↑ helps gradeAssembly Member Michael Novakhov endorsed the Stop Super Speeders bill on Nov. 24, 2025, after previously defending reckless driving. The bill would force speed‑limiters into repeat offenders’ cars after repeated camera tickets, aiming to prevent deadly high‑speed crashes.
- 2025-11-24 · Leadership · Streetsblog NYC · ↑ helps gradeA Brooklyn Republican who defended speeding at a funeral endorsed the Stop Super Speeders bill on 2025-11-24. The measure would install speed-limiting devices in repeat speeders’ cars to force compliance with posted limits.
- 2025-11-12 · Leadership · New York Post · ↑ helps gradeProposal would force court-ordered speed-limiter devices into chronic speeders’ cars. Devices link to ignitions, cap speed by GPS, and reset by zones. Demo held Nov. 12, 2025. Backers say the tech can slow deadly drivers and save lives.
- 2025-06-11 · Vote · Open States · ↑ helps gradeSenate backs S 4045. Repeat speeders face forced installation of speed assistance tech. Eleven points or six camera tickets triggers action. Law targets reckless drivers. Streets may get safer for those outside the car.
- 2025-06-11 · Leadership · Streetsblog NYC · ↑ helps gradeSenate gutted the Super Speeder Bill at midnight. Over 130,000 reckless drivers dodge speed-limiter rules. Only the worst offenders face consequences. Pedestrians and cyclists stay exposed. Lawmakers chose drivers over safety. The city’s deadliest keep rolling. Streets stay dangerous.
- 2025-06-11 · Vote · Open States · ↓ hurts gradeSenate passed S 7785. The bill carves out large Mitchell-Lama housing from bus traffic rules. Lawmakers voted yes. The carve-out weakens enforcement. Streets grow less safe for people on foot and bike.
- 2025-06-11 · Vote · Open States · ↓ hurts gradeSenate passed S 7785. The bill carves out large Mitchell-Lama housing from bus traffic rules. Lawmakers voted yes. The carve-out weakens enforcement. Streets grow less safe for people on foot and bike.
- 2026-06-11 · Leadership · NYC Council – Legistar · ↑ helps gradeRes 0511-2026 moved to committee. It backs tougher toll-violation enforcement and tools to punish ghost plates. The aim is to stop drivers who dodge cameras and keep speeding past accountability.
- 2026-06-11 · Leadership · NYC Council – Legistar · ↑ helps gradeRes 0511-2026 moved to committee. It backs tougher toll-violation enforcement and tools to punish ghost plates. The aim is to stop drivers who dodge cameras and keep speeding past accountability.
- 2026-06-11 · Leadership · NYC Council – Legistar · ↑ helps gradeRes 0511-2026 moved to committee, backing tougher toll and ghost-plate enforcement. It calls for stronger penalties and new tools like plate-cover seizures, liens, and VIN blocks to stop drivers dodging cameras and tolls.
- 2026-05-11 · Leadership · Streetsblog Empire State · ↑ helps gradeA plan targets drivers with 16 speed-camera tickets in 12 months. It would order a speed governor after the 16th hit. But the piece says weak rules and weak follow-through could leave repeat speeding on the street.
- 2026-06-11 · Leadership · NYC Council – Legistar · ↑ helps gradeRes 0511-2026 moved to committee. It backs tougher toll-violation enforcement and tools to punish ghost plates. The aim is to stop drivers who dodge cameras and keep speeding past accountability.
- 2026-06-11 · Leadership · NYC Council – Legistar · ↑ helps gradeRes 0511-2026 moved to committee. It backs tougher toll-violation enforcement and tools to punish ghost plates. The aim is to stop drivers who dodge cameras and keep speeding past accountability.
- 2026-06-11 · Leadership · NYC Council – Legistar · ↑ helps gradeRes 0511-2026 moved to committee, backing tougher toll and ghost-plate enforcement. It calls for stronger penalties and new tools like plate-cover seizures, liens, and VIN blocks to stop drivers dodging cameras and tolls.
- 2026-05-11 · Leadership · Streetsblog Empire State · ↑ helps gradeA plan targets drivers with 16 speed-camera tickets in 12 months. It would order a speed governor after the 16th hit. But the piece says weak rules and weak follow-through could leave repeat speeding on the street.
497 Carroll St. Suite 31, Brooklyn, NY 11215
718-238-6044
Room 917, Legislative Office Building, Albany, NY 12247
518-455-3270
Assembly Member Marcela Mitaynes F (50)*
District 51
- 2022-09-08 · Leadership · gothamist.com · ↑ helps gradeCouncilmember Alexa Avilés pushes new rules to rein in e-commerce warehouses. The bill would block massive facilities near homes, schools, and parks. It demands public review and stricter permits. The aim: less truck traffic, cleaner air, safer streets.
- 2022-06-02 · Vote · Open States · ↑ helps gradeSenate passed S 5602 to keep school zone speed cameras running longer. More eyes on reckless drivers. Lawmakers push back against speeding near kids. The vote was clear. The danger remains.
- 2022-05-31 · Vote · Open States · ↓ hurts gradeAssembly and Senate passed A 8933. The bill shields emergency vehicle operators from fines for traffic violations during medical calls. Vulnerable road users face more risk. Accountability weakens. Streets grow more dangerous.
- 2022-05-31 · Vote · Open States · ↓ hurts gradeAssembly and Senate passed A 8933. The bill shields emergency vehicle operators from fines for traffic violations during medical calls. Vulnerable road users face more risk. Accountability weakens. Streets grow more dangerous.
- 2022-05-25 · Vote · Open States · ↑ helps gradeSenate passed S 5602 to keep school zone speed cameras running longer. More eyes on reckless drivers. Lawmakers push back against speeding near kids. The vote was clear. The danger remains.
- 2023-11-29 · Leadership · brooklynpaper.com · ↑ helps gradeRed Hook chokes on truck fumes. Lawmakers move. The Clean Deliveries Act aims to cut emissions from sprawling e-commerce warehouses. Kristen Gonzalez and others demand action. Diesel trucks crowd narrow streets. Pollution and danger rise. Residents pay the price.
- 2023-07-18 · Leadership · amny.com · ↑ helps gradeBrooklyn officials demand equal tolls on all Manhattan crossings. They warn free bridges funnel traffic into certain neighborhoods. Their letter calls for fairness. The MTA stays silent. The Traffic Mobility Review Board will decide. Streets hang in the balance.
- 2023-06-06 · Vote · Open States · ↑ helps gradeAlbany gets speed cameras near schools. Lawmakers pass A 7043. Cameras catch drivers who endanger kids. The program runs until 2028. Streets near schools face new watchful eyes.
- 2023-06-06 · Vote · Open States · ↑ helps gradeAlbany gets speed cameras near schools. Lawmakers pass A 7043. Cameras catch drivers who endanger kids. The program runs until 2028. Streets near schools face new watchful eyes.
- 2023-06-06 · Vote · Open States · ↑ helps gradeAlbany gets speed cameras near schools. Lawmakers pass A 7043. Cameras catch drivers who endanger kids. The program runs until 2028. Streets near schools face new watchful eyes.
- 2023-06-06 · Vote · Open States · ↑ helps gradeAlbany gets speed cameras near schools. Lawmakers pass A 7043. Cameras catch drivers who endanger kids. The program runs until 2028. Streets near schools face new watchful eyes.
- 2023-06-06 · Vote · Open States · ↑ helps gradeMitaynes votes yes to require recall checks before used car sales.
- 2023-06-06 · Vote · Open States · ↑ helps gradeMitaynes votes yes to require recall checks before used car sales.
- 2024-06-07 · Vote · Open States · ↑ helps gradeAssembly passes A 7652. Schenectady gets school speed cameras. Law aims to slow drivers near kids. Cameras expire in 2028. Vote split. Streets may get safer for children on foot.
- 2024-06-07 · Vote · Open States · ↑ helps gradeAssembly passes A 7652. Schenectady gets school speed cameras. Law aims to slow drivers near kids. Cameras expire in 2028. Vote split. Streets may get safer for children on foot.
- 2024-06-07 · Vote · Open States · ↑ helps gradeLawmakers back speed cameras near Kingston schools. Cameras catch drivers who speed. The bill passed both chambers. It sunsets in 2029. Children and families walk safer, but the fix is temporary.
- 2024-06-06 · Vote · Open States · ↑ helps gradeLawmakers back speed cameras near Kingston schools. Cameras catch drivers who speed. The bill passed both chambers. It sunsets in 2029. Children and families walk safer, but the fix is temporary.
- 2024-06-07 · Vote · Open States · ↑ helps gradeAssembly passes A 7652. Schenectady gets school speed cameras. Law aims to slow drivers near kids. Cameras expire in 2028. Vote split. Streets may get safer for children on foot.
- 2024-06-07 · Vote · Open States · ↑ helps gradeAssembly passes A 7652. Schenectady gets school speed cameras. Law aims to slow drivers near kids. Cameras expire in 2028. Vote split. Streets may get safer for children on foot.
- 2024-06-07 · Vote · Open States · ↑ helps gradeLawmakers back speed cameras near Kingston schools. Cameras catch drivers who speed. The bill passed both chambers. It sunsets in 2029. Children and families walk safer, but the fix is temporary.
- 2024-06-06 · Vote · Open States · ↑ helps gradeLawmakers back speed cameras near Kingston schools. Cameras catch drivers who speed. The bill passed both chambers. It sunsets in 2029. Children and families walk safer, but the fix is temporary.
- 2025-07-24 · Leadership · BKReader · ↑ helps gradeEighty dead or maimed on Third Avenue since 2018. Sunset Park stands up. Residents, officials, and advocates demand the city end delays. No fixes yet. Danger remains.
- 2025-07-23 · Leadership · Brooklyn Paper · ↓ hurts gradeTwo pedestrians killed. Advocates and local leaders demand action. City stalls. Third Avenue stays deadly. Anger and grief fill Sunset Park.
- 2025-06-17 · Vote · Open States · ↑ helps gradeSenate passes S 8344. School speed zone rules in New York City get extended. Lawmakers make technical fixes. The bill keeps pressure on drivers near schools. Streets stay a little safer for kids.
- 2025-06-16 · Vote · Open States · ↓ hurts gradeSenate passed S 7785. The bill carves out large Mitchell-Lama housing from bus traffic rules. Lawmakers voted yes. The carve-out weakens enforcement. Streets grow less safe for people on foot and bike.
- 2025-06-11 · Vote · Open States · ↓ hurts gradeSenate passed S 7785. The bill carves out large Mitchell-Lama housing from bus traffic rules. Lawmakers voted yes. The carve-out weakens enforcement. Streets grow less safe for people on foot and bike.
- 2025-06-11 · Vote · Open States · ↑ helps gradeWhite Plains gets speed cameras near schools. Lawmakers move fast. Most vote yes. Cameras catch drivers who endanger kids. Program ends 2030. Streets may slow. Danger faces children every day.
- 2025-05-07 · Vote · Open States · ↑ helps gradeMitaynes votes yes on transportation budget bill with no safety impact.
- 2025-05-07 · Vote · Open States · ↑ helps gradeMitaynes votes yes on transportation budget bill with no safety impact.
- 2026-01-30 · Sponsor · Open StatesMitaynes co-sponsors climate and community investment act, with no safety impact.
- 2026-01-23 · Leadership · Streetsblog Empire State · ↓ hurts gradeAlbany held a hearing on e-bikes. Lawmakers mixed up classes and speed. Some floated car-style licensing and insurance. The talk could squeeze riders while bigger crash danger keeps rolling.
- 2025-07-24 · Leadership · BKReader · ↑ helps gradeEighty dead or maimed on Third Avenue since 2018. Sunset Park stands up. Residents, officials, and advocates demand the city end delays. No fixes yet. Danger remains.
- 2025-07-23 · Leadership · Brooklyn Paper · ↓ hurts gradeTwo pedestrians killed. Advocates and local leaders demand action. City stalls. Third Avenue stays deadly. Anger and grief fill Sunset Park.
4907 4th Ave. Suite 1A, Brooklyn, NY 11220
718-492-6334
Room 741, Legislative Office Building, Albany, NY 12248
518-455-3821
Borough President Antonio Reynoso —
Council Member Alexa Avilés A (99)
District 38
- 2024-12-19 · Vote · NYC Council – Legistar · ↓ hurts gradeAvilés votes yes on bill requiring FDNY consultation for street projects.
- 2024-12-05 · Sponsor · NYC Council – Legistar · ↑ helps gradeCouncil bill bars cars from blocking crosswalks. No standing or parking within 20 feet. City must install daylighting barriers at 1,000 intersections yearly. Streets clear. Sightlines open. Danger cut.
- • Neutral2024-09-26 · Sponsor · NYC Council – LegistarCouncil bill slashes legal parking time for big rigs. Ninety minutes max for tractor-trailers. Three hours for other commercial trucks. Streets clear faster. Heavy metal moves on.
- 2024-09-26 · Vote · NYC Council – Legistar · ↑ helps gradeCouncil ends jaywalking penalties. Pedestrians now cross anywhere, any time. No summons. Law strips drivers of excuses. Streets shift. Power tilts to people on foot.
- 2024-04-18 · Sponsor · NYC Council – Legistar · ↑ helps gradeCouncil orders swift removal of abandoned and unplated cars. Streets clear in 72 hours. Police target vehicles with missing or fake plates. Fewer hazards for those on foot and bike.
- 2024-03-19 · Sponsor · NYC Council – Legistar · ↑ helps gradeCouncil bill orders DOT to repair broken curbs during street resurfacing. Hazardous curbs trip, trap, and injure. The fix is overdue. Pedestrians need solid ground. Council moves to force action.
- 2024-03-07 · Sponsor · NYC Council – Legistar · ↑ helps gradeCouncil bill demands DOT fix NYCHA sidewalks first. Seniors come before all. Broken walks trip, injure, kill. Law forces city to show its work. No more hiding behind red tape.
- 2024-02-28 · Sponsor · NYC Council – Legistar · ↑ helps gradeCouncil moves to outlaw fake plates. Fraud hides reckless drivers. Bill targets sellers, sets fines. Streets need truth. Law aims to strip shields from danger.
- 2025-10-29 · Sponsor · NYC Council – Legistar · ↑ helps gradeStricter limits, supervisor authorization, and a ban on PIT maneuvers reduce the frequency and intensity of high‑speed chases, lowering risk to pedestrians and cyclists. Aerial handoff and disengagement further shift enforcement away from dangerous street pursuits, improving system-wide safety.
- 2025-10-29 · Sponsor · NYC Council – LegistarInt 1446-2025 forces DOT to accept sidewalk and roadway cafe applications online and at public locations. Applicants can save drafts. It bars mandatory professional drawing approval while preserving DOT review of required clearances.
- 2025-08-26 · Leadership · amny.com · ↑ helps gradeMayor Adams vetoed a council push to decriminalize street vending. Vendors clustered on the narrow Brooklyn Bridge walkway. Crowding squeezes pedestrians, collides with cyclists and strollers, and can impede emergency movement, raising crash and injury risk.
- 2025-07-24 · Leadership · BKReader · ↑ helps gradeEighty dead or maimed on Third Avenue since 2018. Sunset Park stands up. Residents, officials, and advocates demand the city end delays. No fixes yet. Danger remains.
- 2025-05-28 · Sponsor · NYC Council – Legistar · ↑ helps gradeCouncil pushes a bill to cut bike share costs for New Yorkers over 65. The measure aims to open city cycling to more seniors. The committee now weighs its next move.
- 2025-05-28 · Sponsor · NYC Council – Legistar · ↑ helps gradeCouncil bill pushes for discounted bike share rates for New Yorkers 65 and up. The move aims to open city streets to older riders. The measure sits with the Transportation Committee. No safety review yet.
- 2025-05-01 · Vote · NYC Council – LegistarCouncil passes law. Taxis and for-hire cars must post bold warnings on rear doors. Riders face the message: look for cyclists before swinging the door. A move to cut dooring. City acts. Cyclists stay in the crosshairs.
- 2025-04-10 · Vote · NYC Council – Legistar · ↑ helps gradeCouncil passed a law forcing DOT to post sharp, regular updates on street safety projects. Progress on bike lanes, bus lanes, and signals must go public. No more hiding delays or cost overruns. The city must show its work.
- 2026-05-08 · Leadership · Streetsblog NYC · ↓ hurts gradeAfter her truck-map bill widened routes, Alexa Avilés demanded fewer trucks. City Hall moves to expand the network anyway. Big rigs and blind spots press closer to sidewalks and bike lanes.
- 2026-05-07 · Leadership · Streetsblog NYC · ↑ helps gradeGreen-Wood pitched a two-way protected bike path and wider sidewalks. The corridor has seen 97 crashes, 128 injuries, and three deaths. It would trade curb parking for space where people walk and ride.
- • Neutral2026-02-24 · Sponsor · NYC Council – LegistarAvilés primarily sponsors bill setting NYPD firearm discharge blood alcohol testing procedures
- 2026-02-24 · Sponsor · NYC Council – LegistarAvilés primarily sponsors bill establishing officer blood alcohol testing after shootings.
4417 4th Avenue, Ground Floor, Brooklyn, NY 11220
718-439-9012
250 Broadway, Suite 1746, New York, NY 10007
212-788-7387
Police Precinct NYPD 72nd Precinct —
Other Geographies See nearby areas
▸ Other Geographies
SD 26 Senate District 26 sits in AD 51, Brooklyn, District 38, Precinct 72.
It contains Brooklyn CB 2, Brooklyn CB 6, Brooklyn CB 7, Brooklyn CB 10, Brooklyn Heights, Downtown Brooklyn-DUMBO-Boerum Hill, Fort Greene, Carroll Gardens-Cobble Hill-Gowanus-Red Hook, Park Slope, Sunset Park (West), Bay Ridge, Dyker Heights, Dyker Beach Park, The Battery-Governors Island-Ellis Island-Liberty Island.
▸ See also
